Every trader wants to talk about entries. Nobody wants to talk about what happens when the trade goes against them. That’s backwards. Your entry decides how much you might make. Your risk management decides whether you’ll still be trading a year from now.
This post breaks risk management down across three time horizons: short term (day trades and weeklies), mid term (swing trades measured in days to weeks), and long term (your portfolio as a whole). The tools change at each level, but the core idea doesn’t. You are protecting your ability to take the next trade. Along the way I’ll show how we apply this inside Trade The Trigger, using the same tools our members see every day. And we’ll finish with the piece of math, the Kelly Criterion, that explains why every rule in this post points in the same direction: smaller.
The Math You Can’t Argue With
Before we get into timeframes, understand drawdown math, because it’s brutal and it doesn’t care about your feelings.
If you lose 10% of your account, you need an 11% gain to get back to even. Lose 25%, and you need 33%. Lose 50%, and now you need to double your money just to break even. The hole gets deeper faster than most people realize, and climbing out is always harder than falling in.
This is why professional traders obsess over losses more than wins. A trader who makes modest gains but never blows up will outperform a hot streak trader who gives it all back. Every rule in this post exists to keep you out of that hole.
Short Term: Day Trades and Weekly Options
Short term trading is where accounts die fastest, because leverage, speed, and emotion all show up at the same time.
Risk a fixed percentage per trade
The classic number is 1% to 2% of your account on any single trade. If you have a $25,000 account, that means your maximum loss on one trade is $250 to $500. Not the position size, the loss. You can put $2,000 into a trade if your stop is placed where a stop-out costs you $400. Size the position around the loss, not the other way around.
The same logic covers long options, where the premium itself is usually the stop. With a $250 risk budget, a $1.20 weekly contract means two contracts, not ten. Boring math, but the boring math is the point.
Know your exit before you enter
If you can’t answer “where am I wrong?” before clicking buy, you don’t have a trade, you have a hope. For stocks, that means a hard stop at a technical level that invalidates your idea. For short dated options, where stops can be unreliable due to fast premium decay and wide spreads, it often means treating the entire premium as your risk and sizing accordingly.
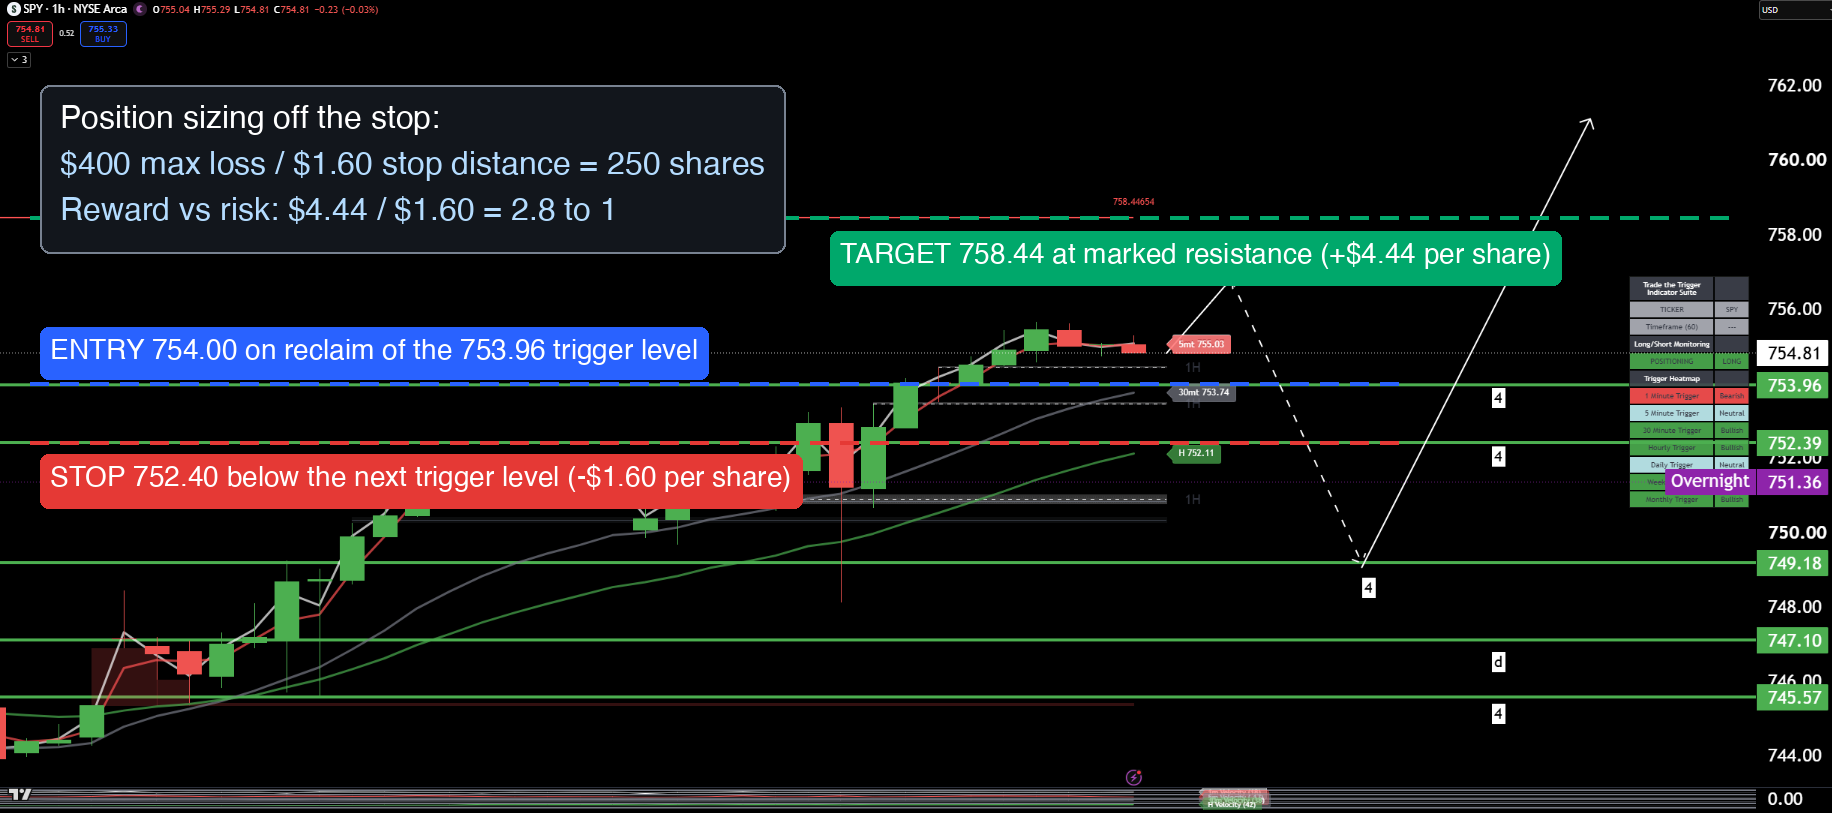
Here’s what that looks like on a real chart. This is the SPY trigger chart from a recent TTT Market Brief, with the trade planned around the published trigger levels: entry on the reclaim of 753.96, stop below the next level down, target at marked resistance. The stop distance is $1.60, so a $400 risk budget buys 250 shares. The math is done before the trade exists.
Respect theta and gamma on weeklies
Options expiring within days move violently. Gamma makes your position’s sensitivity explode near the strike, and theta eats you alive if the move doesn’t come quickly. A 0DTE or weekly contract can lose half its value while the underlying barely moves. If you trade these, size them like lottery tickets, because that’s how they behave. Money you put into same-week expirations should be money you’re fully prepared to lose that day.
Know the gamma regime you’re trading in
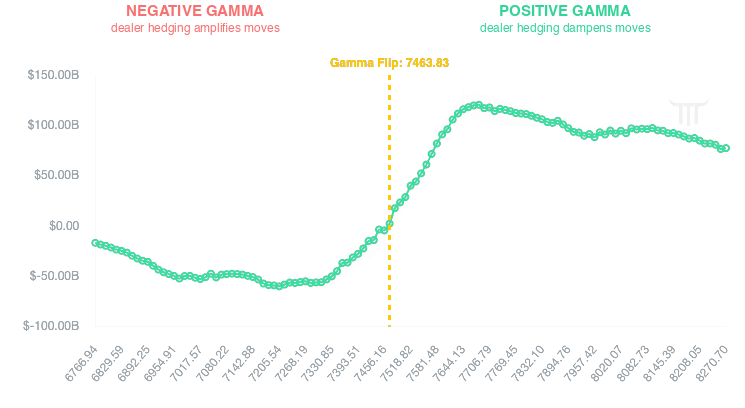
This is exactly why we built the TTT GEX Visualizer. When dealers are in positive gamma, their hedging dampens moves and ranges tend to hold. When the market slips below the gamma flip level into negative gamma, dealer hedging amplifies moves in both directions, and the same position size suddenly carries a lot more risk. Our members check the flip level before sizing any 0DTE trade. Same setup, different regime, different size. The simplest version of the rule: whatever your normal size is above the flip, cut it in half below it. That one habit prevents more blowups than any indicator I know of.
Here’s the tool on a live SPX snapshot. As I write this, net spot gamma is +$40 billion per 1% move, the flip sits at 7463.83, and SPX is trading above it at 7518.82. Positive gamma regime, ranges more likely to hold, normal size is fine. If price were 56 points lower, below the flip, the exact same setup would deserve half the size.
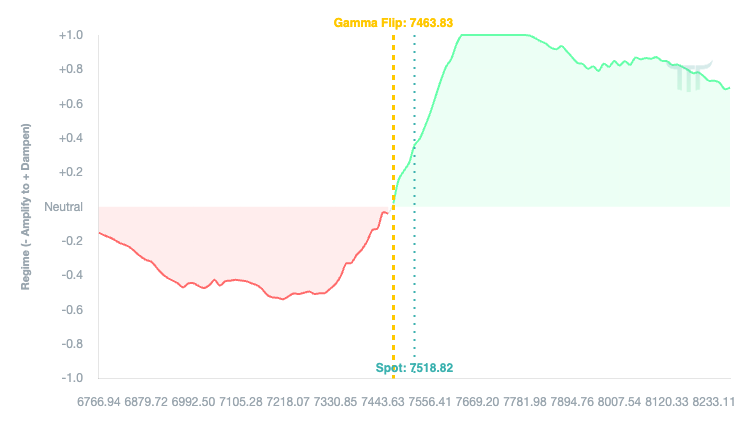
The Gamma Regime Map in the same tool makes it even harder to miss: red zone below the flip where dealer hedging amplifies moves, green zone above it where hedging dampens them, with spot marked so you always know which side you’re trading on.
Cap your daily loss
Set a number where you stop trading for the day, no exceptions. A clean structure is 1% risk per trade with a 3% cap on the day: three straight stop-outs and you’re done until tomorrow. Two or three max-loss trades in a row usually means the market isn’t matching your read, and revenge trading from that spot is how a bad day becomes a bad month. Walk away. The market opens again tomorrow. Use this time to analyze where the last 3 trades might have gone wrong.
Mid Term: Swing Trades
Swing trading gives you more breathing room, but it introduces a new risk: overnight and weekend gaps. Your stop loss doesn’t protect you when the stock gaps 8% below it at the open.
Size for the gap, not just the stop
Because gaps can blow through stops, swing positions should be sized so that even a nasty gap against you stays survivable. If a stock is prone to big earnings moves or sits in a volatile sector, that’s a smaller position, full stop.
Be careful holding short dated options through binary events
Earnings, Fed announcements, CPI prints. Implied volatility inflates before these events and collapses after. Picture a stock at $100 with earnings tonight, and the weekly $105 calls carrying 90% implied volatility. The stock gaps up to $103, a real move in your direction, and IV collapses to 45%. Those calls can open below where you bought them. You were right on direction and still lost money, because IV crush took more out of the premium than the move put in. If you want event exposure, use defined risk structures like debit spreads or iron condors where your max loss is fixed the moment you enter.
Give spreads room to work
For swings, defined risk spreads are your friend. A debit spread costs less than a naked long option, reduces your theta bleed, and caps your loss at what you paid. The tradeoff is capped upside, and that’s a trade worth making most of the time. You’re not trying to hit home runs on every swing. You’re trying to stack singles and doubles without striking out on a dead account.
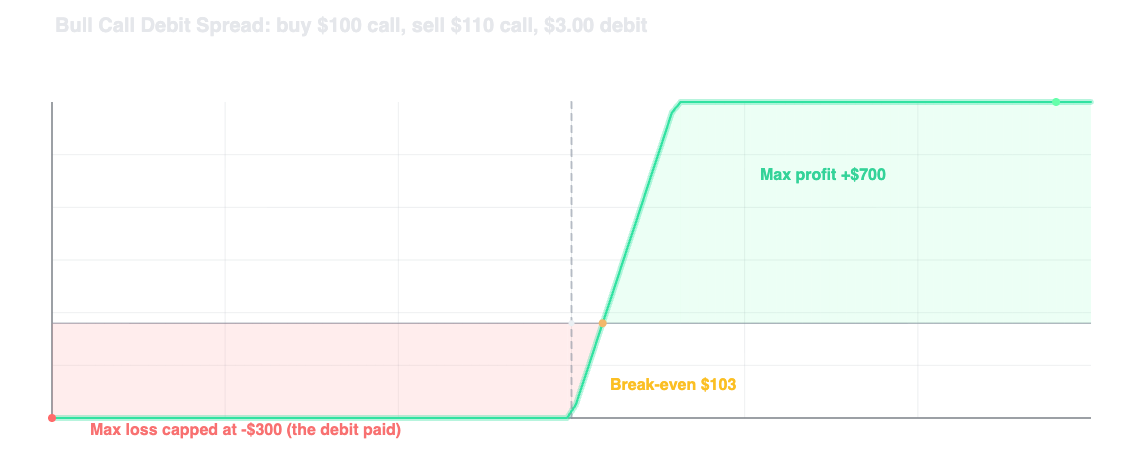
This is what the TTT Options Profit Calculator is for. Pick the structure, and the payoff chart shows you exactly where you’re capped on both sides before you commit a dollar. Here’s a bull call debit spread: pay $3.00, and the left side of that curve is flat at negative $300 no matter what the stock does. That flat line is the whole point.
Define invalidation with structure, not vibes
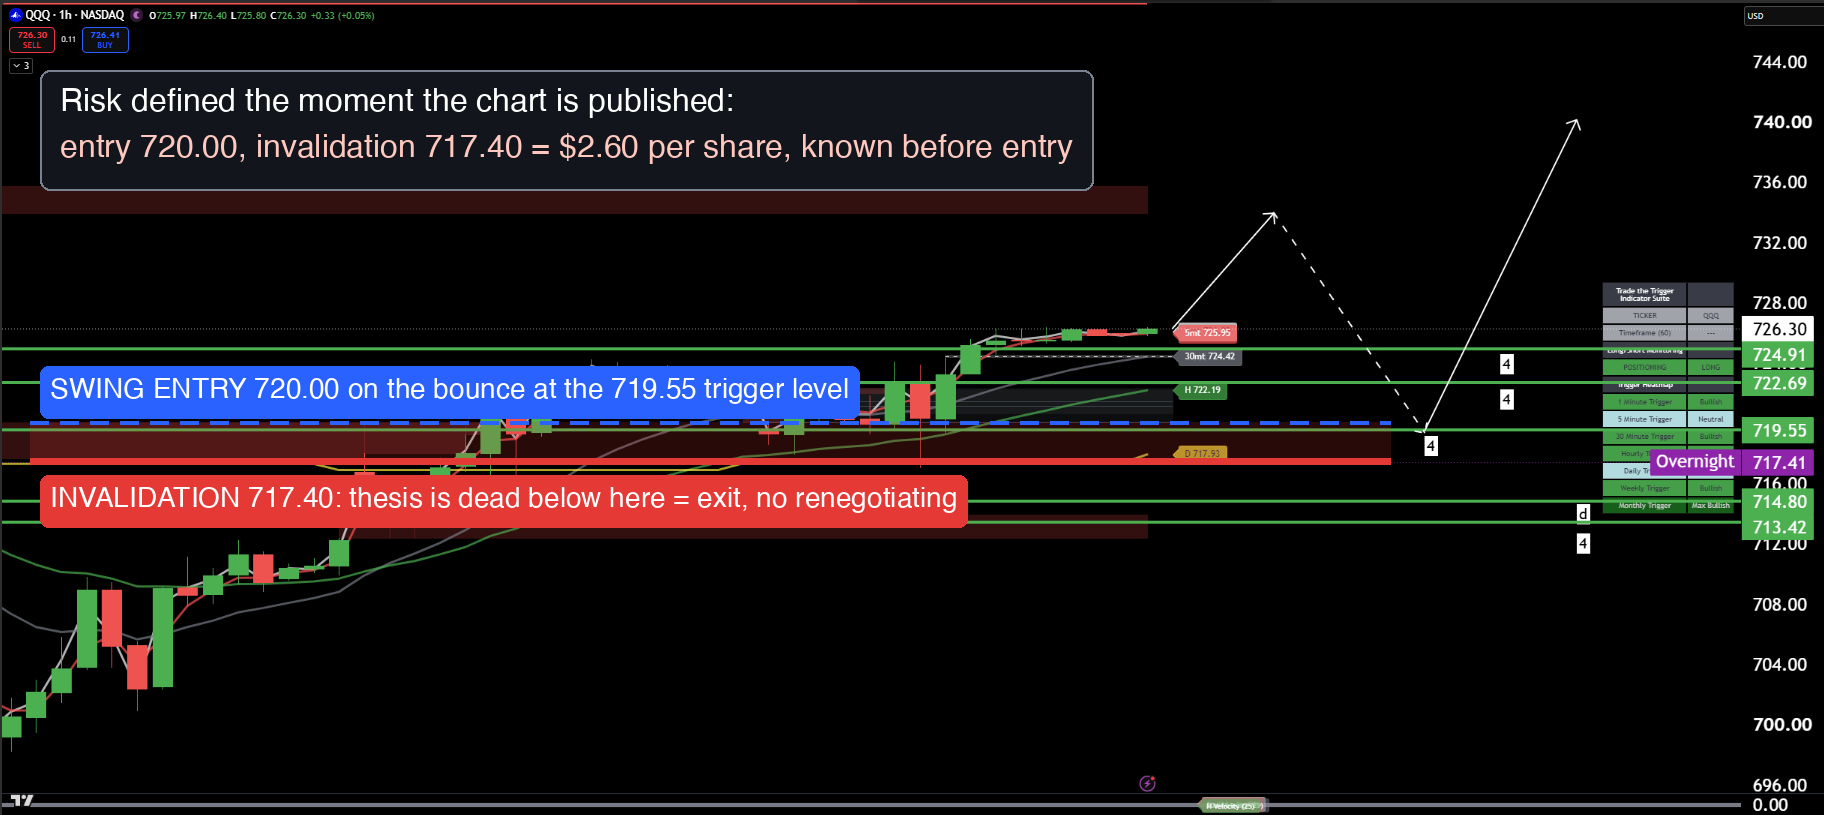
Every chart in a TTT Market Brief comes with marked trigger levels and a projected path, and the trigger charts for SPY, QQQ, and the other majors update on TradingView twice a day. Those levels aren’t decoration. They’re pre-built invalidation points. If you’re swinging a position off one of those charts, your risk is defined the moment the chart is published: below the level that breaks the idea, the thesis is dead and so is the trade. No renegotiating with yourself at 2 AM.
Here’s the QQQ chart from the same Market Brief. The projected path calls for a bounce at the 719.55 trigger level. If you take that swing, the overnight level just underneath is your line in the sand, and your risk per share is known before you ever click buy.
Manage winners, not just losers
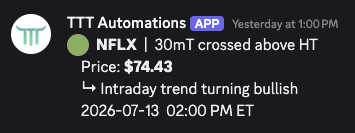
A common mid-term mistake is letting a solid winner round trip back to breakeven. Have a plan for taking partial profits or trailing your stop as the trade moves in your favor. Locking in gains is risk management too, because unrealized profit you give back is a real loss to your compounding. This is also where alerts earn their keep. Our Discord Trigger crossover alerts exist so you’re not glued to a screen all day; you set the level that matters and get pinged when price gets there, instead of discovering the damage after the fact.
Long Term: The Portfolio Level
Zoom out far enough and risk management stops being about individual trades and starts being about structure.
Separate your capital by purpose
Long term investments, swing capital, and short term trading money should be mentally (and ideally literally) separate buckets. The fastest way to wreck a retirement account is to start “borrowing” from it to double down on a losing trade. Decide your allocations when you’re calm, and don’t renegotiate them when you’re tilted.
Watch correlation, not just diversification
Owning ten tech stocks is not diversification, it’s one bet with ten tickers. In a real selloff, correlations go to one and everything drops together. True diversification means exposure across sectors, asset classes, and strategies that don’t all lose at the same time.
Respect concentration risk in income strategies
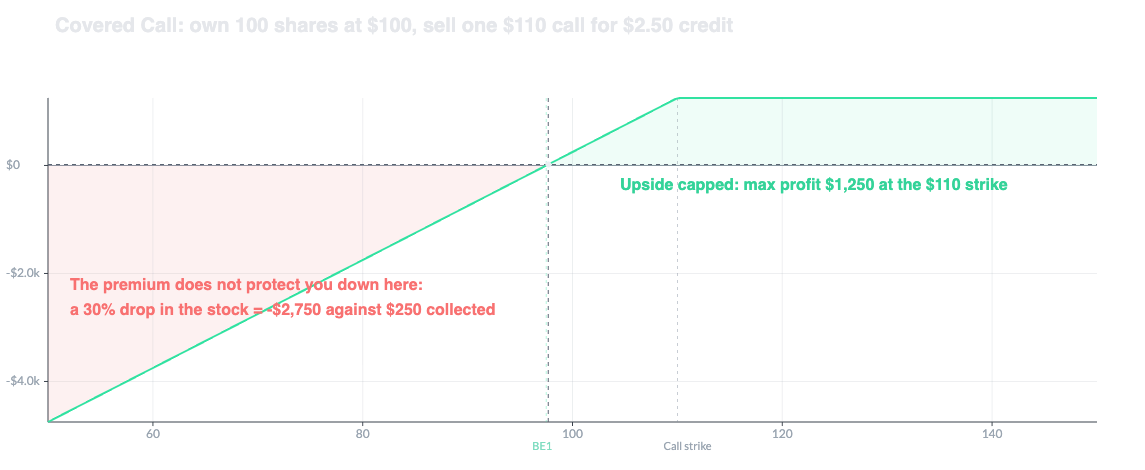
Covered calls and cash secured puts feel safe because you collect premium regularly. But if you’re wheeling the same stock over and over, you’re carrying heavy single-name risk. The premium income is real, and so is the drawdown when that one name drops 30%.
The TTT Options Selling Lab makes this asymmetry impossible to ignore. Here’s a standard covered call: $250 collected, upside capped at $1,250, and a downside slope that looks exactly like owning the stock, because you do. Run your wheel candidates through it and look at the left side of the curve before you fall in love with the yield.
Track your numbers
Long term risk management is impossible without data. Keep a trade journal with your entry, exit, size, thesis, and result. Over dozens of trades, patterns emerge: which setups actually pay you, which timeframes suit your temperament, where your discipline breaks down. Your expectancy (average win times win rate, minus average loss times loss rate) tells you whether your system makes money at all. Say you win 55% of the time, your average winner is $300, and your average loser is $250:
Expectancy = (0.55 × $300) − (0.45 × $250) = $52.50 per trade
Positive number, tradeable system. Most traders have no idea what theirs is. Don’t be most traders.
And if you don’t yet have a system worth measuring, don’t fund the lesson with real money. The TTT Paper Trader gives you live option chains, real trade tickets, open positions, and account analytics, so you can build execution reps and generate the journal data first. As one of our Discord members put it, nobody ever blew up trading paper.
Plan for the tail
Once or twice a decade the market does something nobody’s model predicted. Holding some cash, avoiding excessive leverage, and never being in a position where one event can end you is what lets you survive those moments and, frankly, buy from the people who didn’t plan for them.
The Math Behind the Rules: The Kelly Criterion
Everything above tells you to size smaller than you want to. The Kelly Criterion is the math that proves why, and it’s worth understanding even if you never calculate it directly. Nick Yoder has an excellent deep dive on this at nickyoder.com/kelly-criterion. Here’s what actually matters for traders.
There’s an optimal bet size, and it’s smaller than you think
Kelly’s formula takes your win probability (p), loss probability (q), and payoff ratio (b), and spits out the fraction of your bankroll (f*) that maximizes long-term growth:
f* = bp − qb
A bet you win 52% of the time at even money, a real, tradeable edge, gets you a Kelly size of 4% of your bankroll. Not 20%. Not “half my account because I’m sure.” Four percent, for a genuine edge.
Your edge grows linearly, the damage grows with the square
This is the core insight, and it’s worth reading twice. Yoder walks through a bet that gains 6% or loses 5% on a coin flip, a clear positive edge. Run it 1,000 times at the optimal 1.66x leverage and $100 grows to about $6,340. Push it to 3x leverage, same edge, same trades, and you end up with $447. At 4x you end with less than $2. The edge never changed. Only the size did, and it took the result from a fortune to nothing. Oversizing doesn’t just add risk, it mathematically destroys a winning strategy.
Kelly is the boundary, not the goal
Betting full Kelly assumes you know your true win rate and payoff exactly, and that you don’t care about drawdowns at all. Both are false for every real trader. Your backtest edge is measured with error, live markets are worse than your sample, and you have a stomach. Full Kelly is the cliff edge where growth stops improving and starts collapsing. You want to stand well back from it.
Fractional Kelly is the professional standard
The tradeoff is heavily in your favor. Betting half of Kelly keeps about 75% of the optimal growth rate with a quarter of the variance. Betting 30% of Kelly keeps about half the growth with 1/11th the variance, and drops the odds of an 80% drawdown from roughly 1 in 5 to 1 in 213. Professional money managers commonly run 0.10x to 0.15x of Kelly. When the pros have the best data in the business and still bet a tenth of “optimal,” take the hint.
Sandbag your inputs
Kelly tells you the optimal size given your probabilities. It doesn’t tell you your probabilities. Those come from your data, and your data flatters you. Assume your real win rate is worse than your journal says, then bet a fraction of the Kelly number that comes out. This is also where your trade journal and expectancy numbers stop being bookkeeping and start being inputs: win rate, average win, and average loss are exactly the variables Kelly needs, and tools like the Paper Trader let you collect them before real money is on the line.
Notice what this framework confirms: the 1% to 2% risk rule from the short-term section isn’t arbitrary caution, it’s roughly what fractional Kelly produces for typical trading edges. The old rule and the math agree. As Ed Seykota put it, there are old traders and there are bold traders, but there are very few old, bold traders.
The Common Thread
Across every timeframe, risk management comes down to the same question: what happens if I’m wrong? Answer it honestly before every trade, size accordingly, and honor your exits. The traders who last aren’t the ones with the best predictions. They’re the ones who made being wrong affordable.
If you want the version to tape to your monitor:
- Know where you’re wrong before you enter, and size off that distance
- Risk 1% to 2% per trade, cap the day at 3%
- Check the gamma regime before sizing anything short dated
- Size swings for the gap, not the stop
- Prefer defined risk structures around binary events
- Keep your buckets separate and your journal honest
- When in doubt, halve your size. Nobody ever blew up from trading too small.
If you want to see this applied live, this is a big part of what we do at Trade The Trigger every day: the GEX Visualizer for regime and sizing context, Market Brief and trigger charts with levels that define where the idea is wrong, the Options Profit Calculator and Options Selling Lab for knowing your worst case before entry, the Paper Trader for building the habits without the tuition, and a Discord where risk gets discussed before entries do. Members don’t just get trade ideas, they get the “here’s where I’m wrong” attached to every one of them.
Nothing here is financial advice. It’s a framework, and frameworks only work if you actually follow them, especially on the days you don’t want to.