
How to Use the Gamma Exposure (GEX) Visualizer: A Complete Guide
If you trade options, or you trade names where options positioning clearly matters, you need a way to see where the market is more likely to get pinned, where it can move cleanly, and where dealer hedging can start pressing on price instead of calming it down. That is exactly what the Gamma Exposure Visualizer is built to do.
I do not use gamma as a magic prediction tool. I use it to understand structure. Where is the market likely to stay sticky? Where can it accelerate? Which expirations are actually driving the tape? Once you understand that, your entries, exits, targets, and risk decisions get a lot cleaner.
The point of this tool is simple. It takes a pile of options data and turns it into a read on market structure you can actually use. Instead of staring at raw chains and trying to guess which levels matter, you can quickly see where positioning is likely to dampen price and where it may amplify the move.
Why Gamma Matters
Most traders hear terms like gamma flip, call wall, put wall, 0DTE, and max pain all the time, but they never turn those ideas into a practical process. Gamma becomes useful when it helps answer real questions.
- Is the market more likely to mean revert or trend?
- Which strikes matter most right now?
- Which expiration is actually driving the book?
- What changes if price moves into a new zone?
At a high level, positive gamma tends to support more dampened price action and negative gamma tends to support more reactive price action. That does not mean gamma tells you exact direction. It means gamma helps explain the environment price is moving through.
Key Terms You Should Understand First
Gamma: The rate of change of delta as the underlying moves.
Gamma Exposure (GEX): A market-wide estimate of how much gamma is sitting in the options book.
Positive GEX: Usually associated with dealer hedging that dampens movement and supports mean reversion.
Negative GEX: Usually associated with dealer hedging that can amplify movement and support trend or acceleration.
Zero Gamma / Gamma Flip: The price level where net gamma changes sign.
Strike: The option strike price where positioning can cluster.
DTE: Days to expiration.
0DTE: Options expiring the same day.
OPEX: Options expiration, usually the monthly cycle traders pay close attention to.
Open Interest: The number of open contracts at a given strike and expiration.
Max Pain: The strike where aggregate option pain is minimized into expiration. Useful as context, not something to worship.
Call Wall / Put Wall: Trader shorthand for heavily positioned strikes that can behave like support, resistance, pinning zones, or magnets.
Start At The Top Of The Tool
Before you get lost in the charts, read the controls and the snapshot data. That tells you exactly what book you are analyzing.
Core Controls
- Ticker lets you choose the underlying.
- Spot Override lets you model a hypothetical price and see how the structure changes.
- Pro Settings let you fine-tune things like OI thresholds, notional filters, strike distance, and expirations.
- Freeze Snapshot locks the current read so you can analyze a stable view instead of chasing a moving target.
Snapshot Bar
- Snapshot time tells you when the view was captured.
- Spot source tells you where the current price is coming from.
- OI timing matters because open interest is often delayed, not truly live.
- Filters tell you exactly what data is included in the read.
That context matters. If the tool is showing net spot GEX per 1 percent move, treat that as a sensitivity estimate. It is not a static pile of money. It is a way to understand how much hedging pressure may show up as price moves.
Quick rule: Read gamma as context, not prophecy. It gives you a map of where dealer flow may dampen or amplify price. It does not replace price action, news, or risk management.
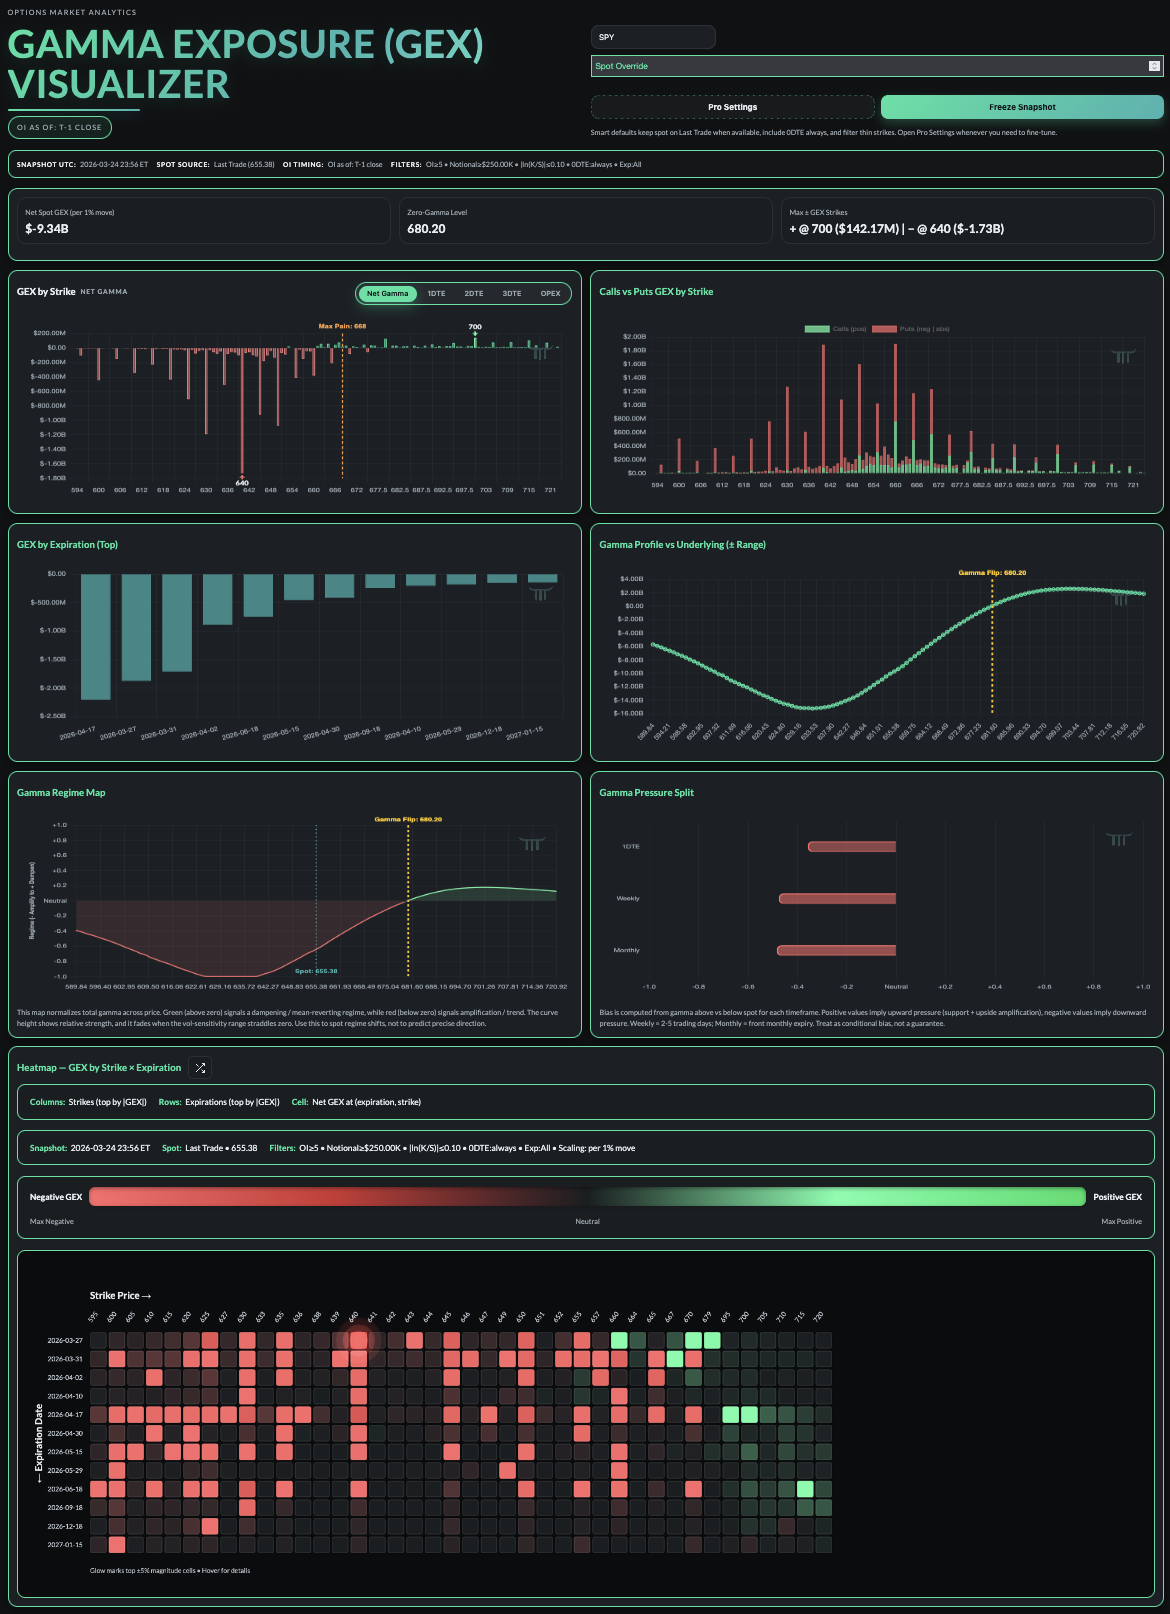
The Three Numbers To Read First
The fastest way to get useful information from the dashboard is to read the headline stats before you touch anything else.
- Net Spot GEX tells you the current posture of the book.
- Zero-Gamma Level tells you where that posture flips.
- Max Positive and Max Negative GEX Strikes show where the largest concentrations are sitting.
That immediately gives you a framework. Is this a more dampened environment or a more reactive one? Where does the regime change? Which strikes deserve attention first?
How To Read Each Part Of The Dashboard
1. GEX By Strike
This is one of the main views in the entire tool. It shows where gamma is concentrated across strikes, and you can break that out by net gamma, 1DTE, 2DTE, 3DTE, or OPEX.
- Tall green bars usually mark dampening zones where dealer flow may lean against price.
- Deep red bars usually mark acceleration zones where dealer flow may reinforce the move.
- The max pain line adds another reference point for the active timeframe.
This is the chart I use to answer a simple question: where are the important strike-based pockets of resistance, support, pinning, or empty air?
2. Calls vs Puts GEX By Strike
A net number can hide the real story. This panel shows whether calls or puts are doing the heavy lifting at each strike.
- If calls are dominating one level, that can help explain why price keeps getting leaned on there.
- If puts are stacked hard at a nearby strike, that may help explain why downside movement gets more aggressive through that zone.
- This is one of the better views for spotting what traders loosely call walls.
3. GEX By Expiration
Not all gamma matters equally. This panel shows which expirations are actually driving the current book.
- If one near-term expiry dominates, that can heavily influence short-term price behavior.
- If the monthly expiry is carrying most of the weight, that matters into OPEX and around bigger positioning shifts.
- This keeps you from treating the whole chain like one undifferentiated blob.
4. Gamma Profile vs Underlying
This shows how total gamma changes as spot moves through a range of prices. The vol-sensitivity band gives you a feel for how stable that read is if implied volatility shifts.
- Watch where the profile crosses zero.
- Pay attention to how sharp or gradual that flip is.
- If the sensitivity band stays firmly on one side of zero, the read is more stable.
- If the band straddles zero, conviction should come down.
5. Gamma Regime Map
This is one of the cleanest panels in the dashboard because it converts the gamma profile into a simpler regime read.
- Green suggests a more dampened, mean-reverting regime.
- Red suggests a more amplified, trend-supportive regime.
- When the curve fades near zero, it is telling you the read is less stable there.
This panel is about market character. It is not trying to give you exact targets.
6. Gamma Pressure Split
This panel breaks directional pressure out by timeframe, typically 1DTE, weekly, and monthly.
- Positive values can imply more support or upward pressure.
- Negative values can imply more downside pressure or heavier downside sensitivity.
- The timeframe split helps you see whether short-term flow and broader structure are aligned or fighting each other.
I treat this as conditional bias, not prediction.
7. Heatmap
The heatmap combines strike and expiration in one view, which is what makes it so useful. Red cells highlight concentrated negative gamma. Green cells highlight concentrated positive gamma. If the biggest cells are clustered in a tight area, that is usually worth paying attention to.
- Use it to find where exposure is concentrated by both strike and expiry.
- Use it to see whether an important level is isolated or supported by a larger cluster.
- Use the flip view to think strike-first or expiry-first depending on what you are trying to answer.
A Practical Workflow
If you want to use the tool without turning it into a science project, keep the process simple.
- Read Net Spot GEX and Zero Gamma first.
- Mark the largest positive and negative strikes.
- Use GEX by Strike to map nearby structure.
- Use Calls vs Puts to see what is creating that structure.
- Check GEX by Expiration to find the dominant expiry.
- Confirm the broader environment with the Gamma Profile and Regime Map.
- Use the Heatmap to see whether those levels are clustered across expirations.
- If you are planning ahead, use Spot Override and Freeze Snapshot to model scenarios before the open or after a big move.
Potential Ways To Use It In Trading
These are not standalone signals. They are ways to turn the dashboard into a process.
Mean Reversion In Positive Gamma
If spot is above the gamma flip and the nearby structure is dominated by positive gamma, I am generally more open to fade setups and reversion trades, especially when price action confirms that read.
Trend Continuation In Negative Gamma
If spot is below the gamma flip and the heatmap shows concentrated negative gamma around or below price, breaks can carry harder than people expect. That is where I stop assuming every move will snap back.
Trading Around The Expiry That Actually Matters
If one expiration is clearly dominating the book, that is the one I care about most. That can matter for day trades, swing timing, and understanding why certain sessions feel heavier or more pinned than others.
Using Zero Gamma As A Risk Line
The gamma flip is one of the cleanest context markers in the tool. Sometimes it is less about taking a trade right at that level and more about knowing that a move through it can change the whole environment.
Scenario Planning With Spot Override
This is one of the most practical features in the dashboard. If you want to know how a gap up, gap down, or post-news move changes the structure, you can model it before price gets there and show up with a plan instead of reacting late.
What The Tool Will Not Do
The Gamma Exposure Visualizer is not a prediction machine. It does not know headlines. It does not replace tape reading. It does not eliminate risk. Open interest is not perfectly real-time, and no gamma model should be treated like a crystal ball.
What it does do is give you a much better framework for understanding why price may get sticky in one zone and move fast in another. That alone can clean up a lot of bad decisions.
Why It Matters Inside Trade The Trigger
The real value is not just having the gamma charts. The value is being able to use this tool alongside the rest of the Trade The Trigger stack and in the same environment where the setups, levels, and market reads are being discussed in real time.
Inside membership, you are not just getting access to the Gamma Exposure Visualizer. You are getting access to the broader toolset and the Discord community where traders are actively working through the same market structure, the same levels, and the same decision points together.