blog posts, viewable by anyone even if not logged in!

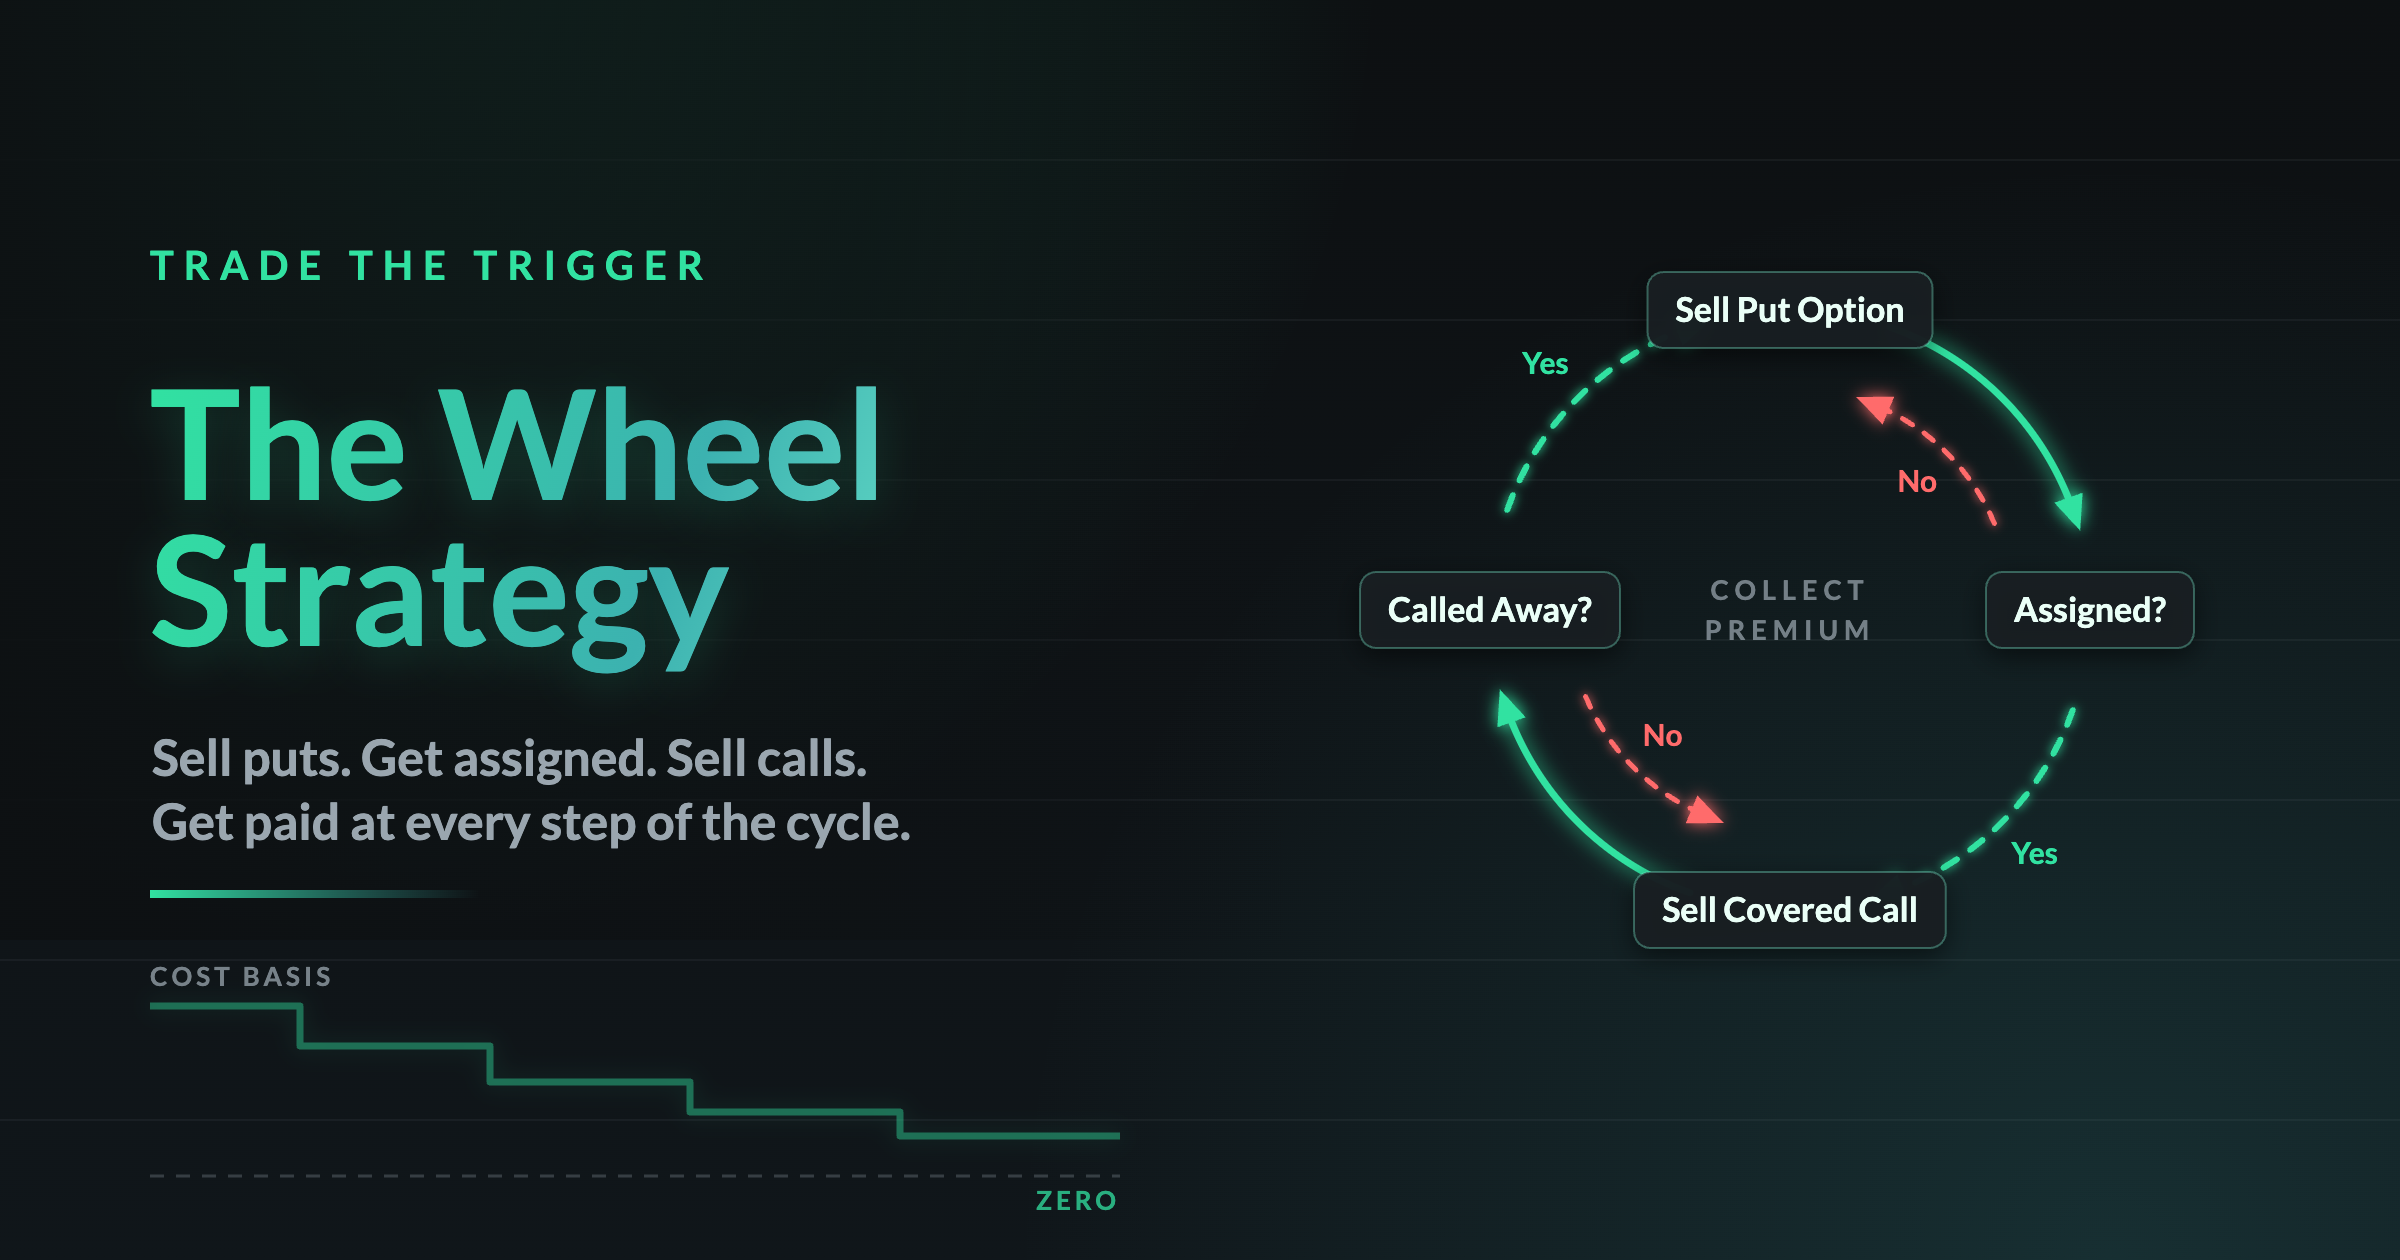
The options wheel strategy cycle: sell a put, get assigned, sell a call, get called away, repeat

The trade

Most people buy a stock and then wait. The wheel pays you while you wait.

The options wheel strategy is two trades run in a loop. You sell a cash-secured put on a stock you would be happy to own. If the put expires out of the money, you keep the premium and sell another one. If it expires in the money you get assigned, you buy the shares at your strike, and you start selling covered calls against them. Every leg collects premium, and every premium you keep lowers what those shares effectively cost you.

Below is the full cycle with real numbers, the math on how a cost basis grinds down, and an honest look at what breaks. Then the four TTT tools that model each leg before you risk anything. All four come with any paid membership, and the breakdown is in who gets what.

Two legs, one loop

How the options wheel strategy works

Both legs are short premium, and both are backed by something: cash secures the put, shares cover the call. Neither carries the open-ended risk of a naked option. The downside on each is still substantial.

  • Cash-secured put. Sell an out-of-the-money put and hold enough cash to buy 100 shares at the strike. Best in a neutral to bullish market. You keep the premium if it finishes above your strike, and you buy the shares at your strike if it finishes below.
  • Covered call. Once you are assigned the shares, sell an out-of-the-money call against them. Best in a neutral to moderately bullish market. You keep the premium if it finishes below your strike, and you sell the shares at your strike if it finishes above.
  • Then repeat. When the shares get called away you are back in cash, and the next put starts the loop again.
tradethetrigger.com/options-selling-lab/
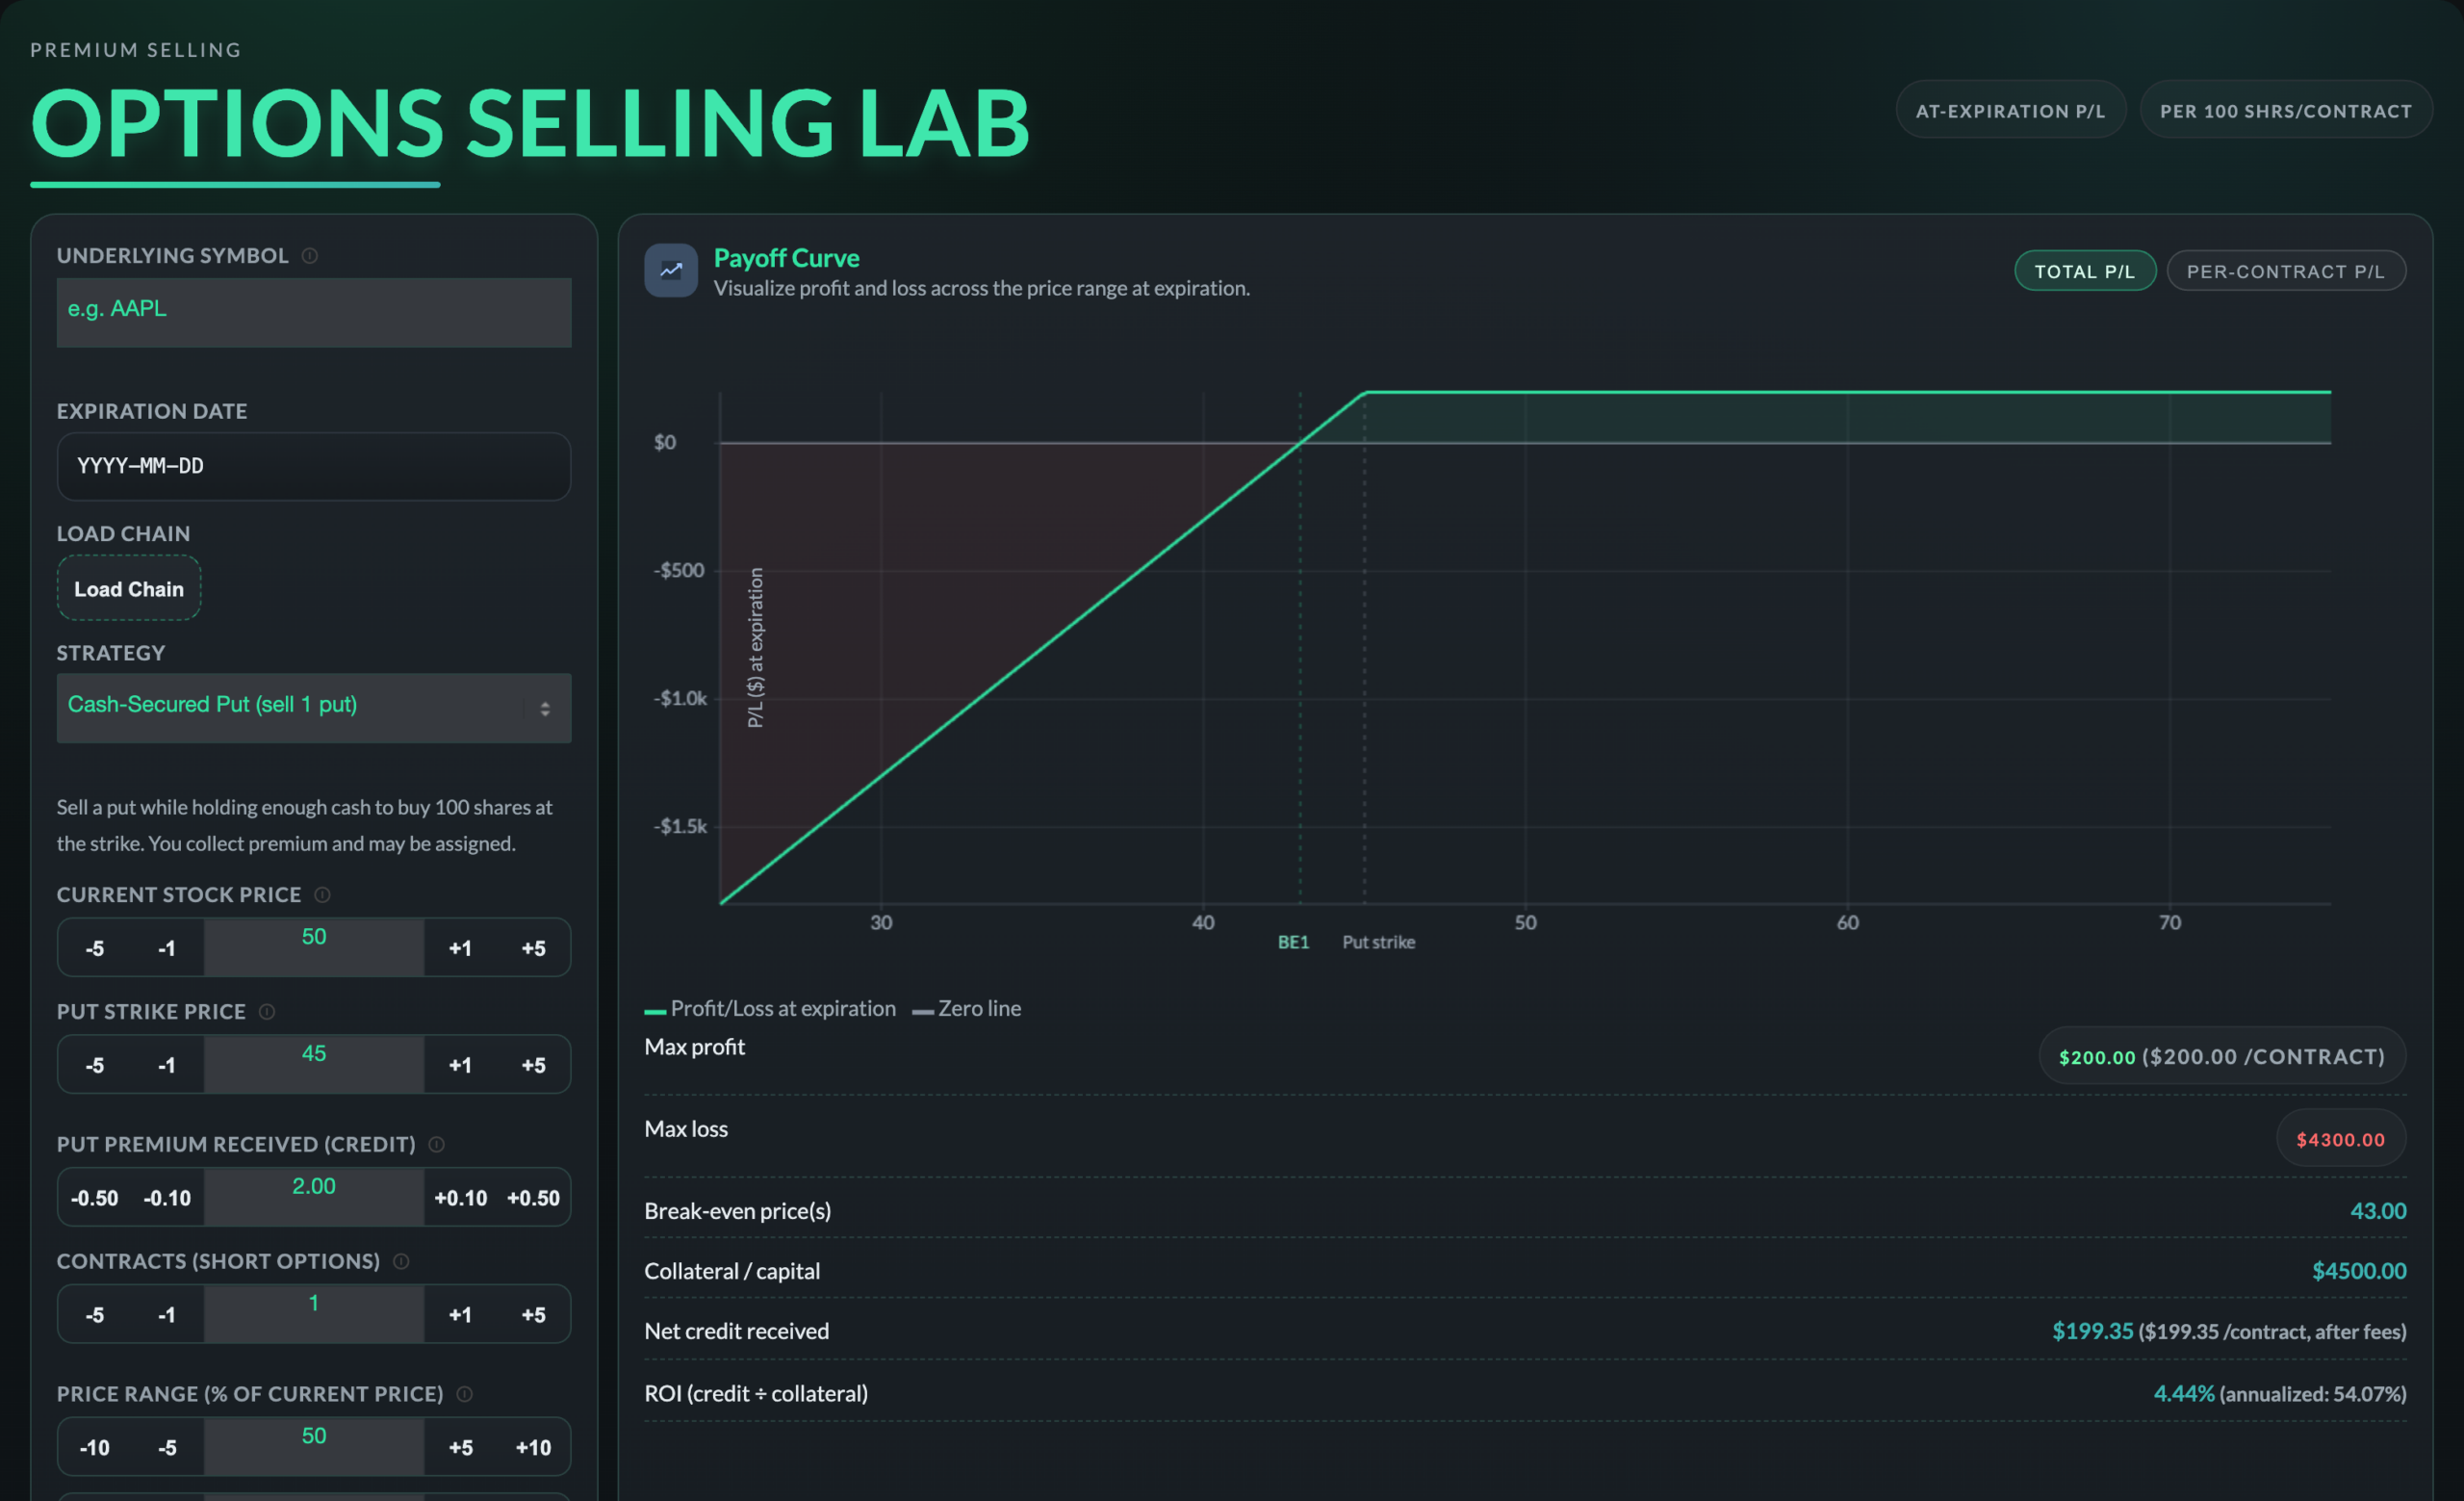
Options Selling Lab modeling a cash-secured put with break-even, collateral and return on capital

The put leg, priced out. A $45 put on a $50 stock for $2.00. The Selling Lab reads it back as $200 max profit, $4,500 of collateral, a $43.00 break-even, and 4.44% return on capital for the cycle. Its own description of the trade: “Sell a put while holding enough cash to buy 100 shares at the strike. You collect premium and may be assigned.”

One turn of the wheel

The full cycle, start to finish

Step 1
Sell the put
Collect premium on a stock you actually want to own, with cash set aside to buy it.
Step 2
Assigned?
Below your strike you buy 100 shares at the strike. Above it there is no assignment, so you sell another put and stay in cash.
Step 3
Sell the call
Sell an out-of-the-money call against the shares and collect again while you hold them.
Step 4
Called away?
Above the call strike the shares sell and you are back to step 1. Below it you keep them and sell another call.

Worked example

Numbers from the Selling Lab, one contract, 30 days out. The big figures are before fees. The net credit line is the one with the $0.65 per contract taken out, which is why it reads $199.35 instead of $200.
1
Sell the $45 put
Stock trades at $50. You sell the $45 put for $2.00 and collect $200, or $199.35 after fees. Your broker sets aside $4,500 in cash. That is 4.44% on the collateral over 30 days, which works out to a simple 54.07% annualized if you could repeat it every cycle.
2
Keep it or take the shares
Above $45 at expiration the put expires worthless and the $200 is yours. Below it you buy 100 shares at $45. Either way the premium is already banked, so your effective cost is $43.
3
Sell the $50 call
You were assigned at $45, and the put premium is already banked, so your adjusted basis is $43. Sell the $50 call for another $2.00 and break-even drops to $41.00, which is $9 below where the stock was trading when you started.
4
Let them go
Above $50 the shares get called away at $50. Full-cycle max profit is $900, which is both $200 premiums plus $500 of share appreciation from $45 to $50. Measured against the $4,500 you had to set aside at the start, that is 20%. Below $50, you keep the shares and sell another call.
tradethetrigger.com/options-selling-lab/
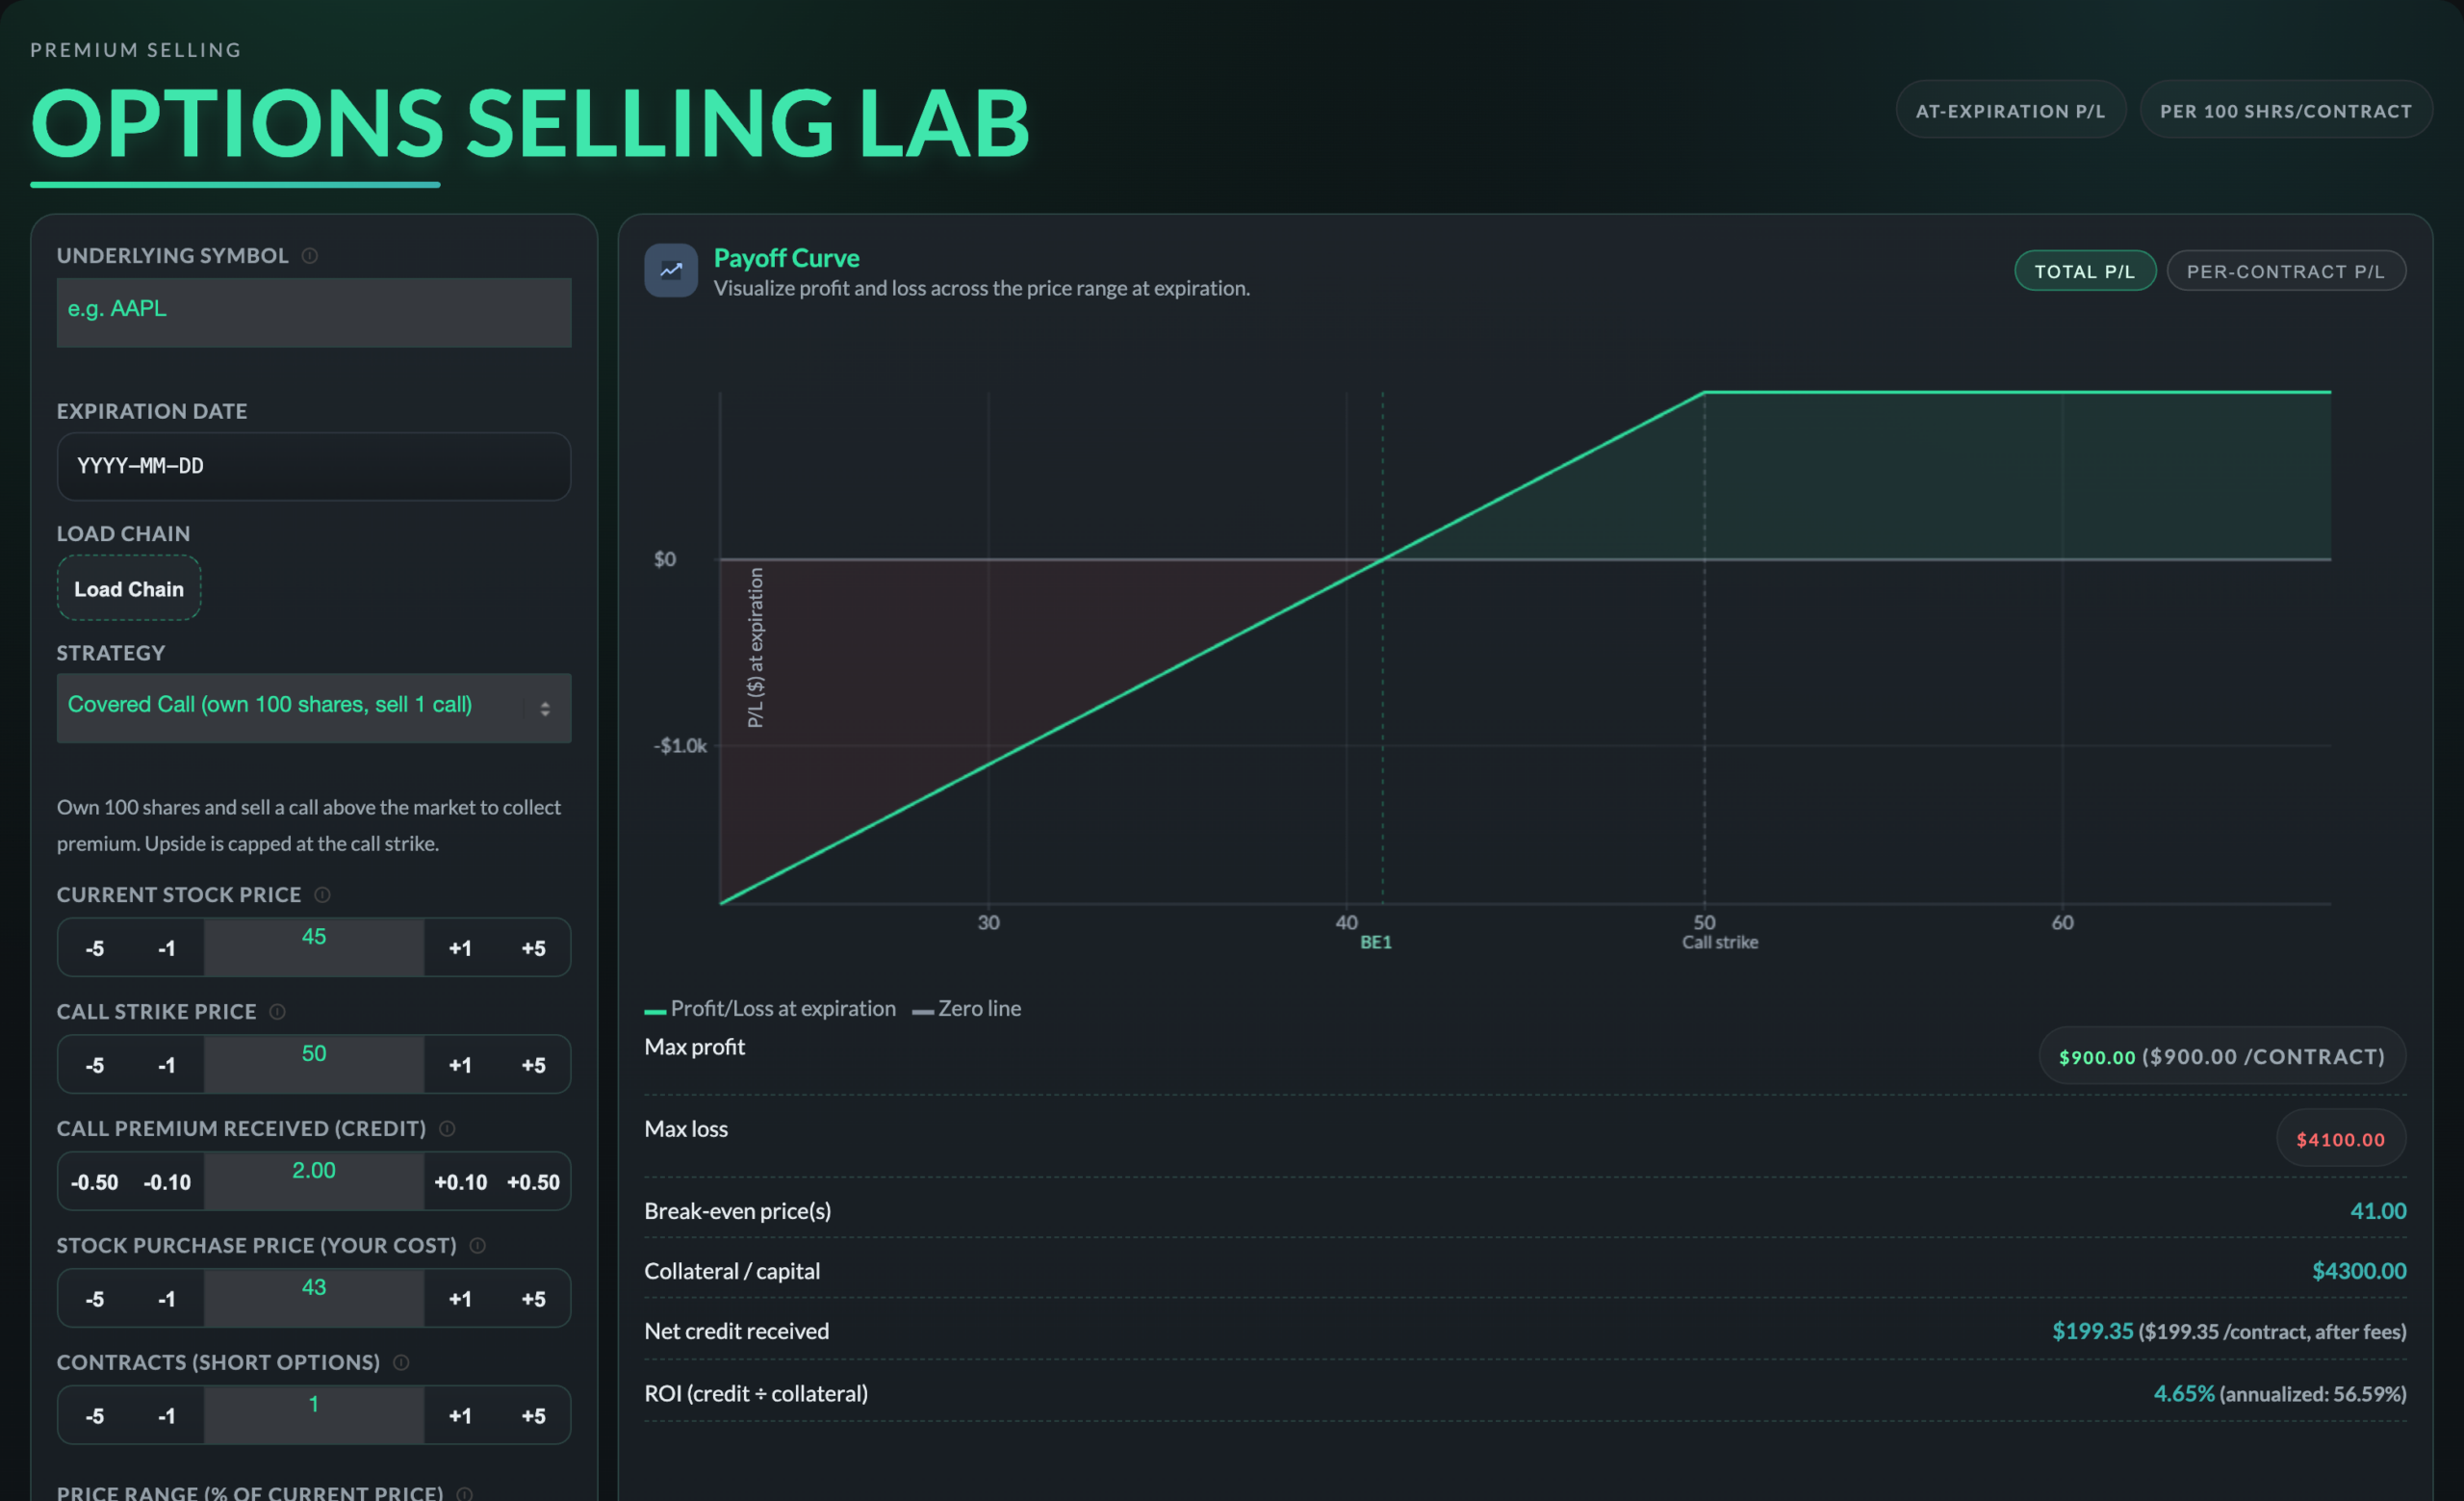
Options Selling Lab modeling a covered call with the cost basis carried down to $43 after the put premium

The call leg, with the basis carried forward. Stock purchase price is set to $43, which is the $45 assignment price less the $2.00 put premium already collected. The break-even reads $41.00 and the payoff flattens hard at the $50 call strike. That flat line is the cost of the trade: your upside stops there.

Why traders run it

Every premium you collect lowers your cost basis

This is the part that makes the options wheel strategy compound. You started with a stock at $50. The put premium took your basis to $43. The call premium took it to $41. Run the loop again next month and it steps down again. Dividends add to the pile too, and they arrive whether or not the options cooperate. Treat this as a running tally of cash recovered against the position, which is a different number from your cost basis on a tax form.

Traders who stay in one name for years talk about the basis eventually reaching zero. At that point the premium and the dividends have paid for the shares outright. A company that keeps raising its payout gets you there faster, since each raise is more cash arriving against a tally that is already shrinking.

A stock split is worth being precise about, because it gets credited with more than it does. A split divides the same position into more, cheaper shares. Total basis, total dividend and total value are all unchanged, so on its own it does not speed anything up. What it does change is granularity: a lower share price means less collateral per contract, so you can wheel the name in smaller increments and scale in and out more finely.

Be straight about what a zero tally is. It is a record of cash recovered. It is not a hedge. The shares are still worth whatever the market says they are worth tomorrow, and they can still fall a long way. Getting there takes years of a stock cooperating, and a single call that gets away ends the compounding in that name. It explains why the wheel appeals to long-horizon holders. It does not make the position safe.

  • Put premium. Lowers the price you effectively paid on assignment. Only premium you actually keep counts, so an option you buy back for more than you sold it works against you.
  • Call premium. Lowers it again for every cycle you hold the shares, net of any buybacks.
  • Dividends. Pay you for holding, independent of what the options do.
  • Time. The only input you cannot rush. This is a multi-year idea, not a multi-week one.
  • Tax, tracked separately. Option premium is not taxed when it lands. It is recognised when the option expires, gets bought back, or is exercised. Ordinary dividends are taxable income and do not reduce your tax basis. Your cash-recovery tally and your tax cost basis are two different numbers, so keep both.

Monitoring

Managing it when price moves against you

The wheel is not a set-and-forget trade. Both legs need watching, and the fix is usually a roll: buy back the short option and sell another one further out in time, at a strike that suits the new situation.

  • Put running deep in the money. Roll down and out to a later expiration and a lower strike. That usually brings in a credit, though buying back a deep in-the-money put can cost more than the new one pays, which makes it a debit roll. Rolling also replaces assignment risk rather than removing it, since the new option is assignable too. The other option is to simply take the shares, which is the whole point if you picked a name you wanted.
  • Call running deep in the money. Roll up and out. Watch one thing carefully: a strike below your adjusted basis caps your sale price under what the shares cost you, so if you get assigned there you take a loss on the stock and need the accumulated premium to cover it.
  • Before you sell either leg. Check that the underlying is unlikely to fall far below your put strike, and that your call strike sits at or above the price you would be happy to sell at.
  • Strike selection. Closer to the money pays more premium and gets assigned more often. Further out pays less and leaves more room. That trade-off is the whole decision.

The honest part

Where the options wheel strategy goes wrong

Selling premium feels like free money right up until it does not. These are the six failure modes worth knowing before you sell the first put.

  • It eats capital. Collateral is the strike times 100, so a $45 strike ties up $4,500 and a $300 strike ties up $30,000, per contract. The strategy is gated by account size long before it is gated by skill.
  • Assignment is not scheduled. American-style equity options can be assigned on any business day, not just at expiration. A short call sitting in the money just before an ex-dividend date is a prime candidate, and getting assigned there costs you the shares and the dividend together. Price pinned right at your strike into expiration is its own headache, because you may not know until the weekend whether you still own stock on Monday.
  • Your upside is capped. The covered call sells your gains above the strike. If the stock gaps 40% past it on earnings, you get the premium and the strike, and you watch the rest go.
  • Assignment is real ownership. Being assigned does not soften the fall. Below your break-even you are long a stock that is dropping, and the premium you collected is a rounding error against it.
  • The wrong name ruins it. Wheeling a company in structural decline means grinding out small premiums against a much larger capital loss. The strategy does not fix the stock you picked.
  • Opportunity cost. Collateral parked behind a put is capital doing one job. In a market that runs hard, simply owning the shares would have paid more. Thin options chains add to the bill, since every roll and early close pays the spread.

The toolkit All paid members

Four tools for running the wheel

Every number in this post came out of the TTT tools. They are built for exactly the work the options wheel strategy asks of you: pricing a short premium trade, checking the return on the capital it ties up, and practicing the mechanics before real money is involved.

Options Selling Lab

The two screenshots above are both from the Options Selling Lab. Cash-secured puts and covered calls are two of its six built-in strategies, alongside short strangles, credit spreads and iron condors. It is the fastest way to answer the question that matters on every leg: what does this pay, and what is it risking to pay it. Premium collected, break-even, collateral, and return on capital both raw and annualized.

Options Profit Calculator

Use the Options Profit Calculator when you want to compare structures rather than price one. Covered Call and Cash Secured Put sit next to each other as one-click templates under Income / Credit, so you can flip between the two legs of the wheel and see how the payoff shape changes.
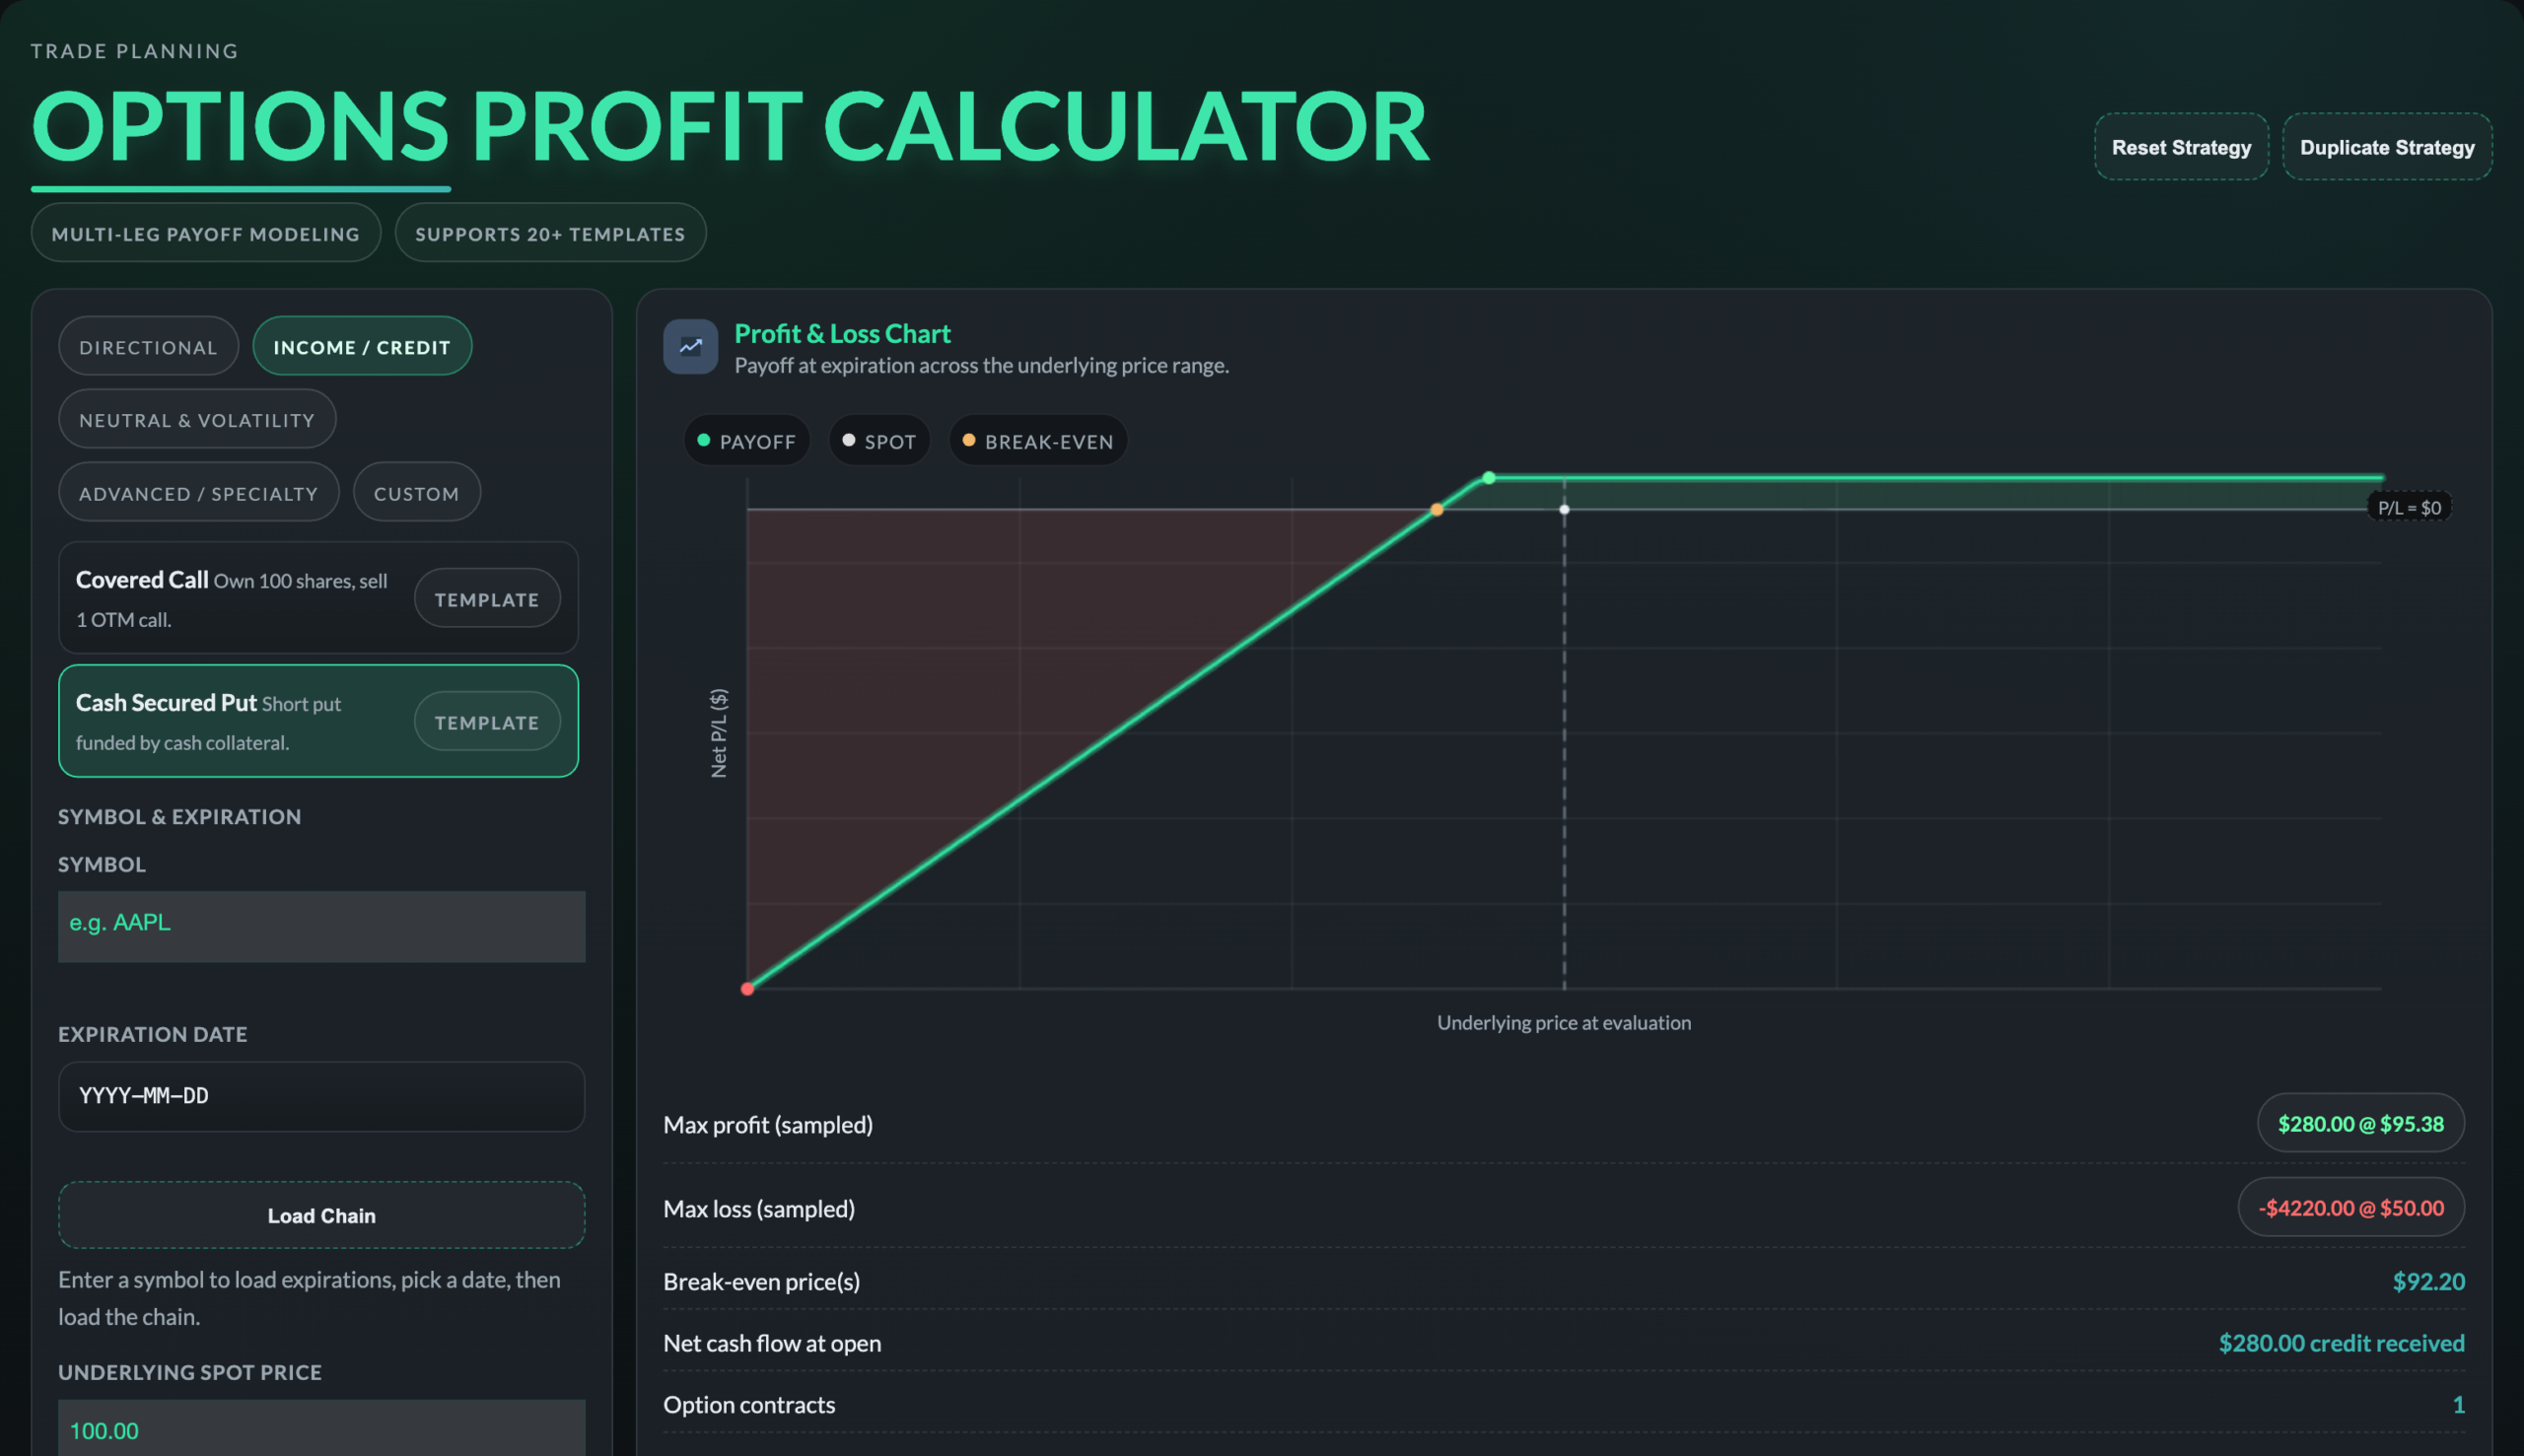
tradethetrigger.com/options-profit-calculator/
Options Profit Calculator with covered call and cash-secured put templates under the income and credit tab

Both wheel legs, one click each. The Income / Credit tab carries Covered Call (“Own 100 shares, sell 1 OTM call”) and Cash Secured Put (“Short put funded by cash collateral”) as templates. Load one, then read max profit, max loss, break-even and net cash flow at open off the same panel.

Paper Trader

Assignment is the step that surprises people. The Paper Trader lets you run a full turn of the wheel on live chain data with no capital at risk, so the first time you get assigned is not also the first time you have seen it happen. Load a chain, route a contract into the ticket, submit, then watch it in open positions and the equity curve.
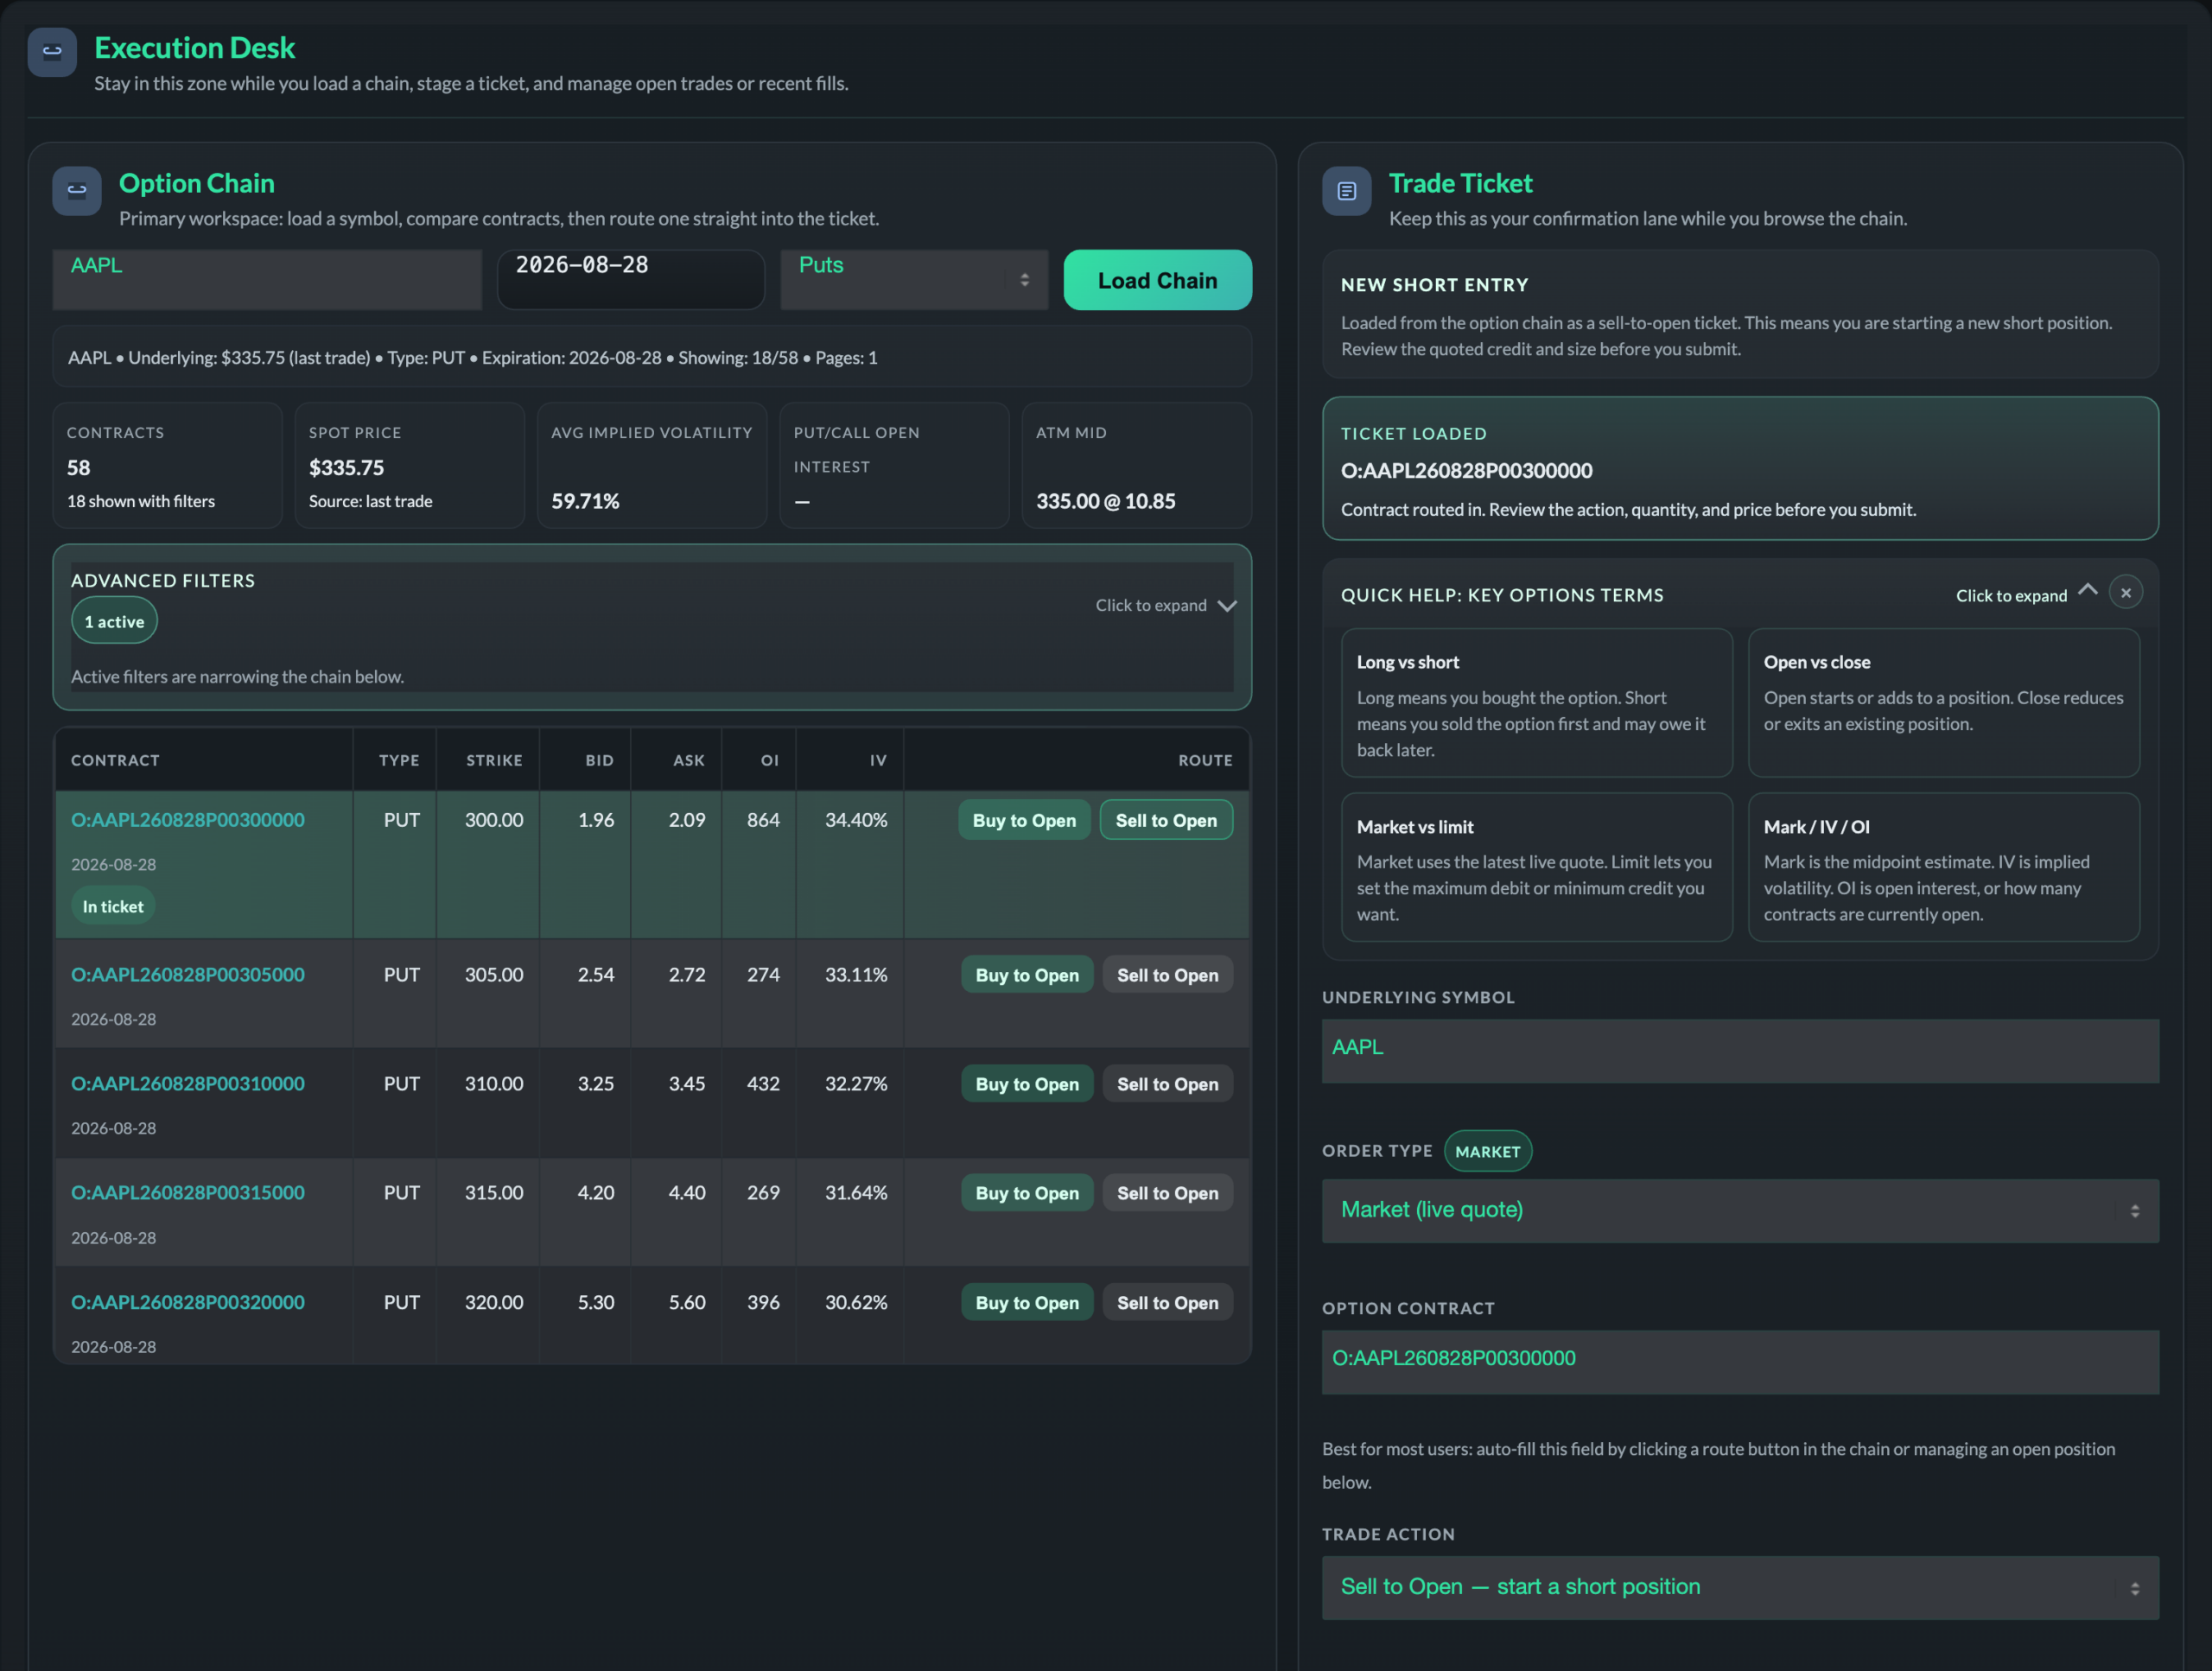
tradethetrigger.com/paper-trader/
Paper Trader option chain with a sell-to-open put staged in the trade ticket for a wheel entry

A put leg staged, not submitted. Live AAPL puts with bid, ask, open interest and implied volatility on every strike. Clicking Sell to Open routes the contract straight into the ticket, which flags it as a NEW SHORT ENTRY and spells out what that means: “This means you are starting a new short position. Review the quoted credit and size before you submit.”

GEX Visualizer

Strike selection is the part of the wheel most people guess at. The GEX Visualizer gives you the options market’s own positioning as context: where dealer gamma is concentrated, where the zero-gamma flip level sits, and which strikes carry the largest positive and negative exposure. Useful when you are deciding how far out of the money to sell.
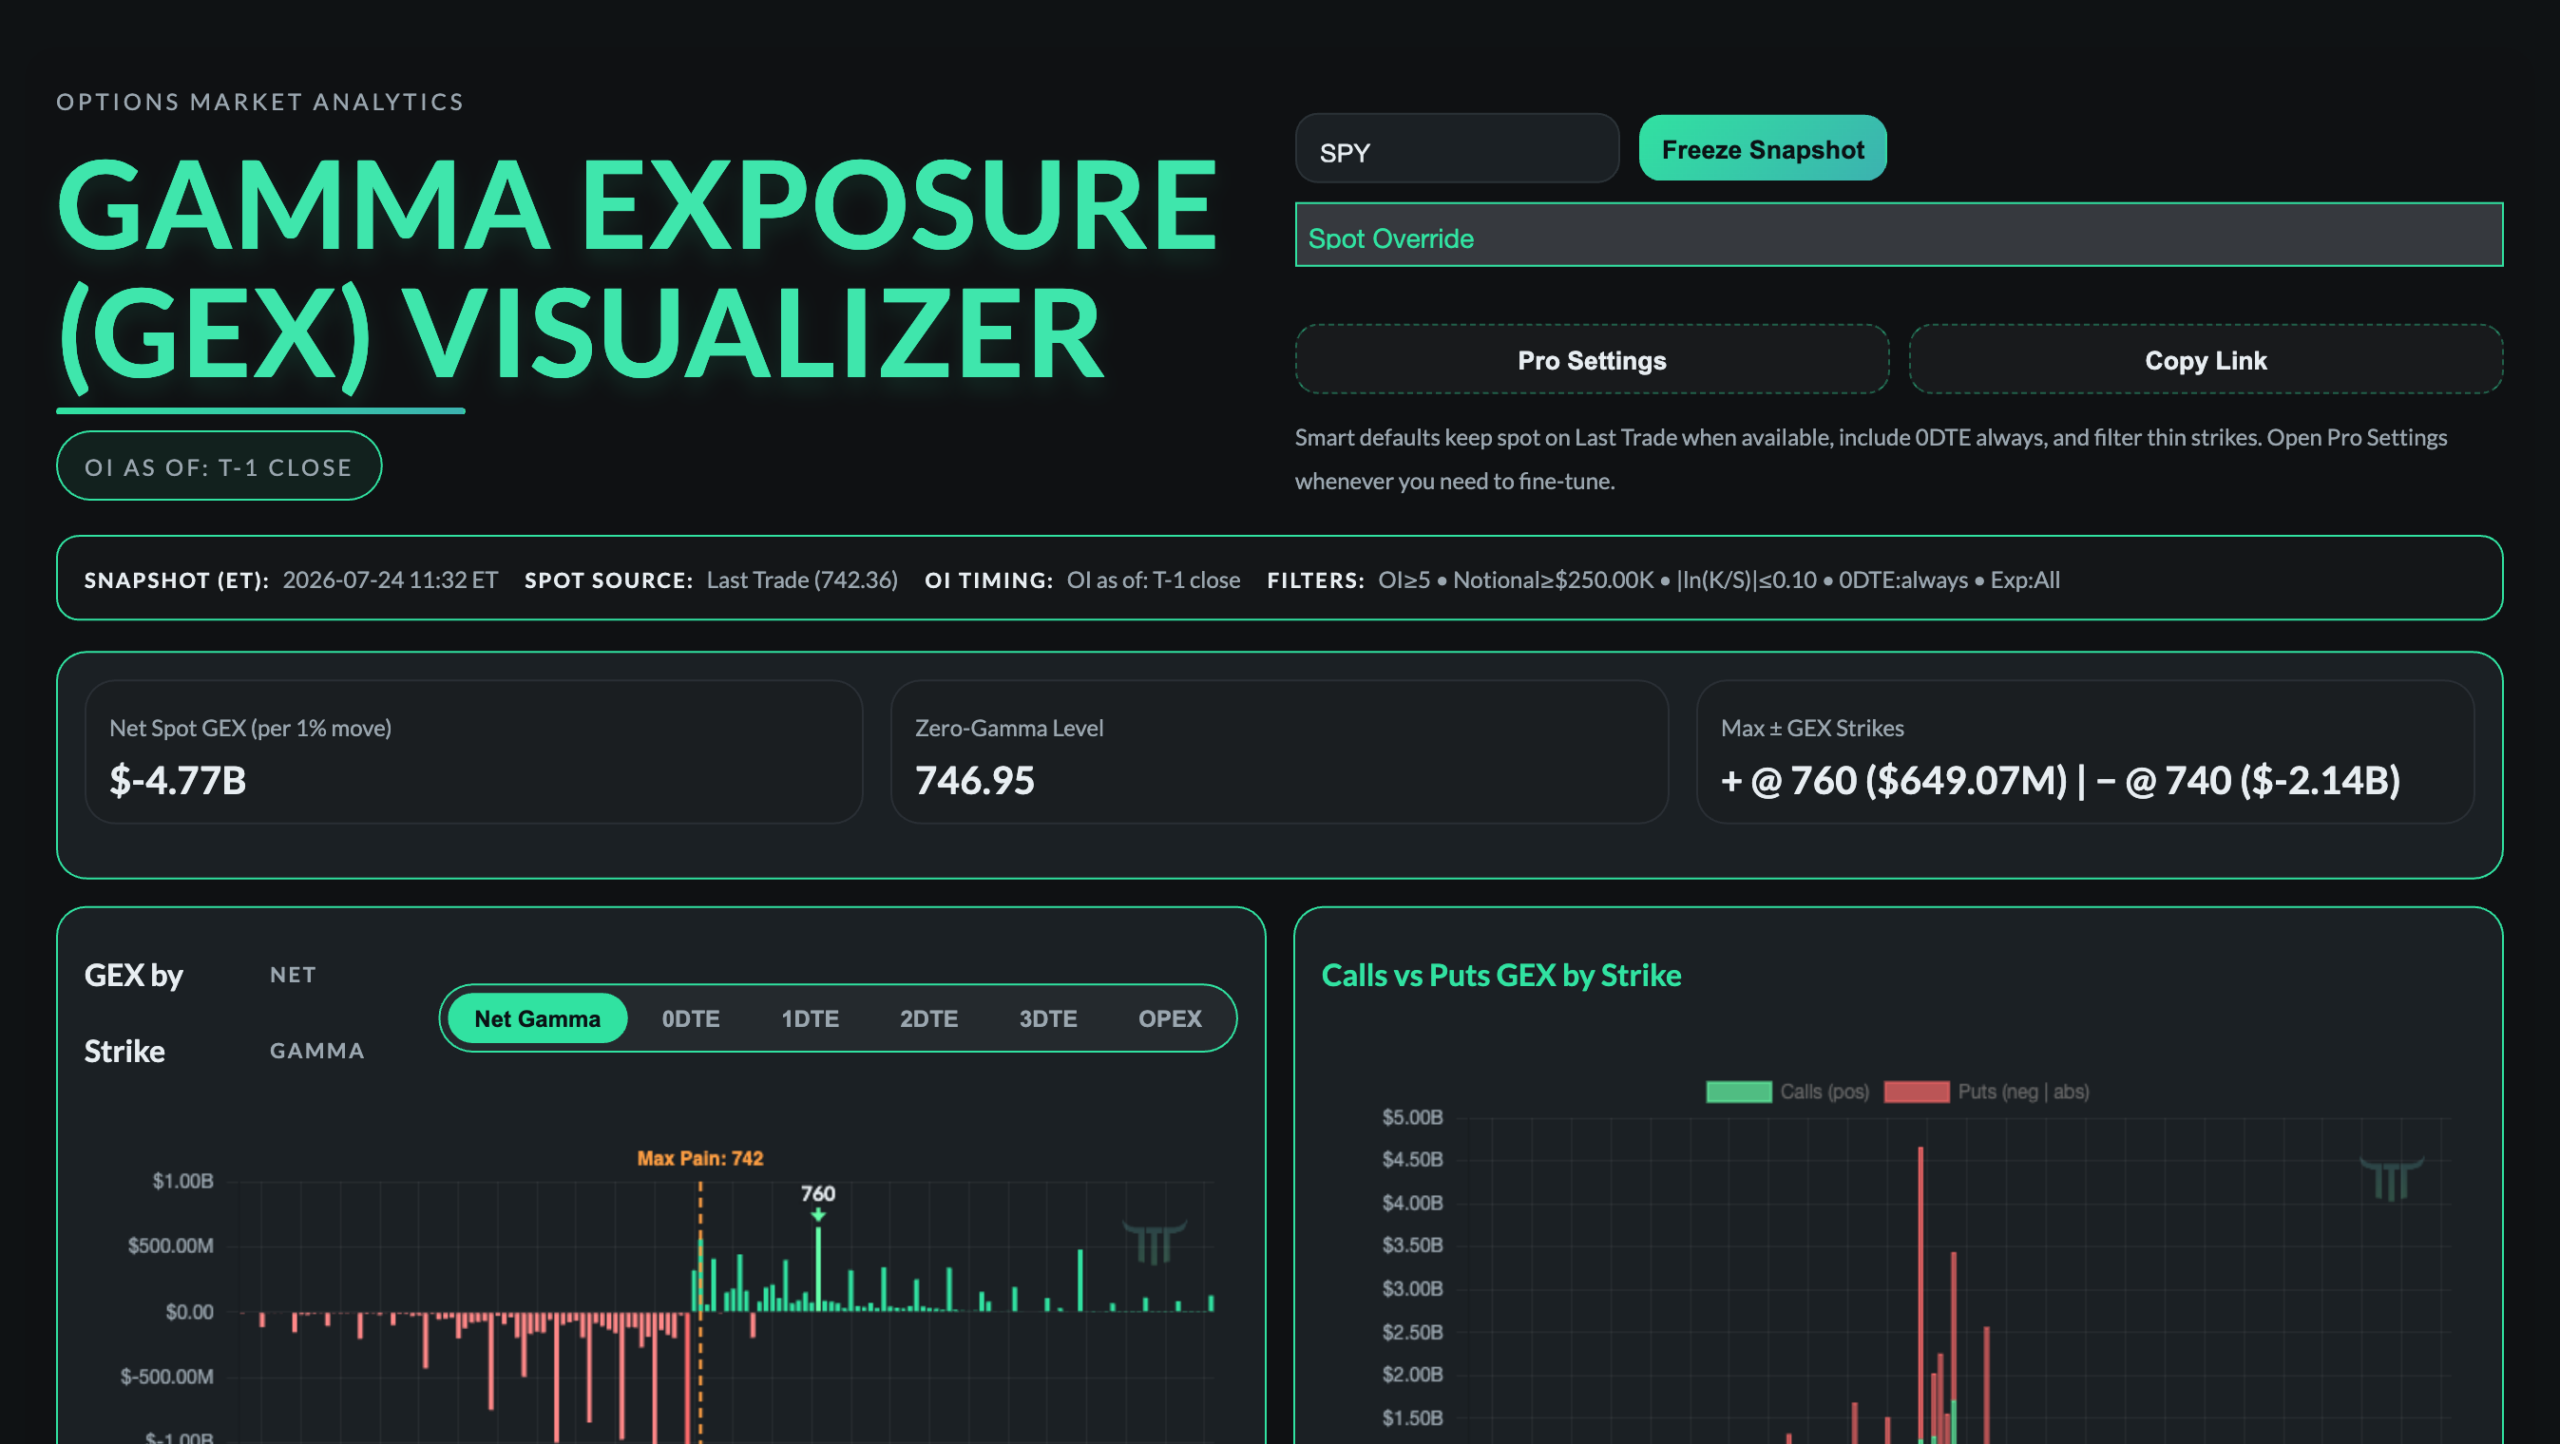
tradethetrigger.com/gamma/
GEX Visualizer showing net spot gamma exposure, zero-gamma level and gamma by strike

Context for where to sell. Net spot GEX, the zero-gamma level, and the largest positive and negative gamma strikes, plus a full breakdown of gamma by strike and calls versus puts. Enter any ticker and freeze a snapshot.

Who gets what

Which membership unlocks the tools

The article you just read is free and always will be. The four tools in it are for members, and any paid membership opens all four. Yearly billing gets you one month free on either tier.

Unlocks every tool above
Subscriber
$49/mo, or $539/yr
  • Options Selling Lab, Options Profit Calculator, Paper Trader and GEX Visualizer
  • T3 Daily Pivots for TradingView, all symbols
  • T3 educational videos and market updates
  • Basic Discord access
  • Tradytics and Unusual Whales premium bots
  • Daily Trigger and Velocity snapshot charts
  • Full T3 Indicator Suite
  • Premium Discord with the T3 team
Pro Trader
$150/mo, or $1,650/yr
  • Everything in Subscriber, including all four options tools
  • Full T3 Indicator Suite for TradingView: Triggers, Velocity and Pivots
  • Premium Discord with direct access to the T3 team
  • Pro Updates
Running the wheel on your own charts? Subscriber gets you every tool in this post. Pro Trader adds the full T3 Indicator Suite and a direct line to the T3 team in the premium Discord, which is where the strike and roll conversations actually happen.

Four steps

Get started

1
Pick a membership
Subscriber at $49/mo opens all four tools. Pro Trader adds the indicator suite and the premium Discord.
2
Price the put
Open the Options Selling Lab, choose Cash-Secured Put, and check the return on capital before the strike.
3
Run a cycle on paper
Use the Paper Trader to sell a put, take assignment, and sell a call without capital on the line.
4
Join the Discord
Bring your strikes and rolls to the community. It is where the management decisions get pressure-tested.

Model your next wheel before you sell it

One membership opens the Selling Lab, the Profit Calculator, the Paper Trader and the GEX Visualizer. Start at Subscriber for all four, or go Pro Trader for the full indicator suite and the premium Discord.

Educational content only. Nothing here is financial advice. Every figure in this post is a worked example from the TTT tools, not a recommendation or a forecast. Options carry real risk, the wheel ties up significant capital, and assignment means owning a stock that can keep falling. Do your own DD and trade your own plan.
Never Miss the Trigger, the new TTT alerts system

The problem

You can’t watch every ticker, on every timeframe, all day. Now you don’t have to.

A Bull/Bear Plane flip on the 30-minute. An HT/DT cross on the daily. A name gapping straight into resistance before you’ve had your coffee. The setups that matter don’t wait for you to be watching, and nobody can sit on charts all session. So TTT does the watching for you now. The new Discord trading alerts hit your DMs the moment something actually fires, and the morning brief tells you where the day is set up before the bell.

All of it comes with Pro Trader, and the GEX Visualizer on the site is open to every paying member. Full breakdown in who gets what.

Real-time alerts Pro Trader

Discord trading alerts, straight to your DMs

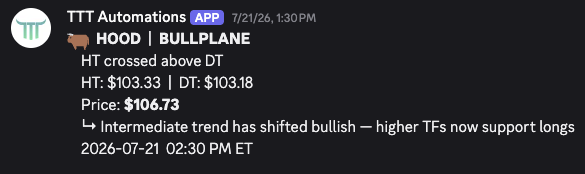
This is the core of the system. TTT tracks trigger crossovers on every timeframe, from the 1-minute Trigger up to the Bull/Bear Plane and HT/DT, on the tickers you pick. The second one fires you get a DM with the stuff that matters: what crossed, the exact levels, the current price, and a quick read on what the shift means.

  • Crossovers. Every timeframe pair, 1mT/5mT up through HT/DT, plus the Bull/Bear Plane.
  • Z-Score. Stretch signals for when price runs too far, too fast.
  • LR Channel. Linear-regression channel touches on the higher timeframes.
A real Discord trading alert DM from TTT: HOOD crossed above its Bull Plane

A real alert. HOOD crosses above its Bull Plane, with the HT/DT levels, the current price, and the read: “Intermediate trend has shifted bullish — higher TFs now support longs.” No noise, no scanning. Just the trigger, right when it happens.

Full control Pro Trader

Your alerts, your rules

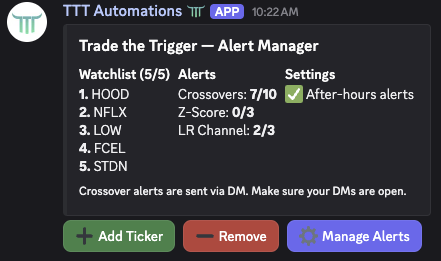
Run /alerts in Discord and you get a full control panel. Build a watchlist of up to five tickers you actually trade, then pick exactly which alerts you want, right down to the individual crossover pair.

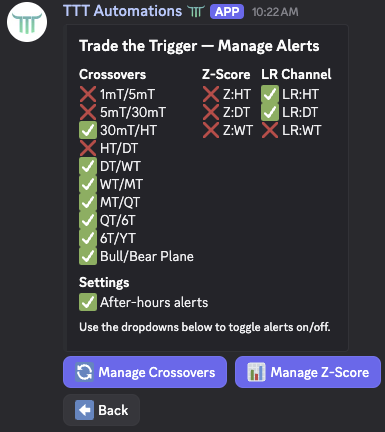
Only care about 30mT/HT and the Bull/Bear Plane? Turn the rest off. Want Z-Score and LR Channel signals too? Flip them on. After-hours alerts are a single switch. Everything updates instantly, and every alert lands in your DMs.

The Alert Manager home panel with watchlist and alert countsThe Manage Alerts panel with per-category toggles

Up top: your watchlist and how many alerts are live in each category. Below that: flip individual crossover, Z-Score, and LR Channel alerts on or off, plus a single after-hours switch.

Every trading morning · 8:00 AM ET Pro Trader

The Daily Pre-Market Brief, in Discord and on the web

Every trading day at 8:00 AM ET, TTT posts a full pre-market briefing. You get an AI-written read on the overnight tape, the setups worth watching, and a thread packed with market internals, per-ticker breakdowns, regime reads, and the news headlines moving your names. It’s the same analysis the desk runs, written in plain English: gaps, resistance shelves, Trigger and Velo alignment, all of it.

Here’s the part that makes it yours: every ticker you track in the Alert Manager gets pulled into the brief automatically, both in Discord and on the web post. Build your watchlist once, and the morning read covers your names, not just the majors.

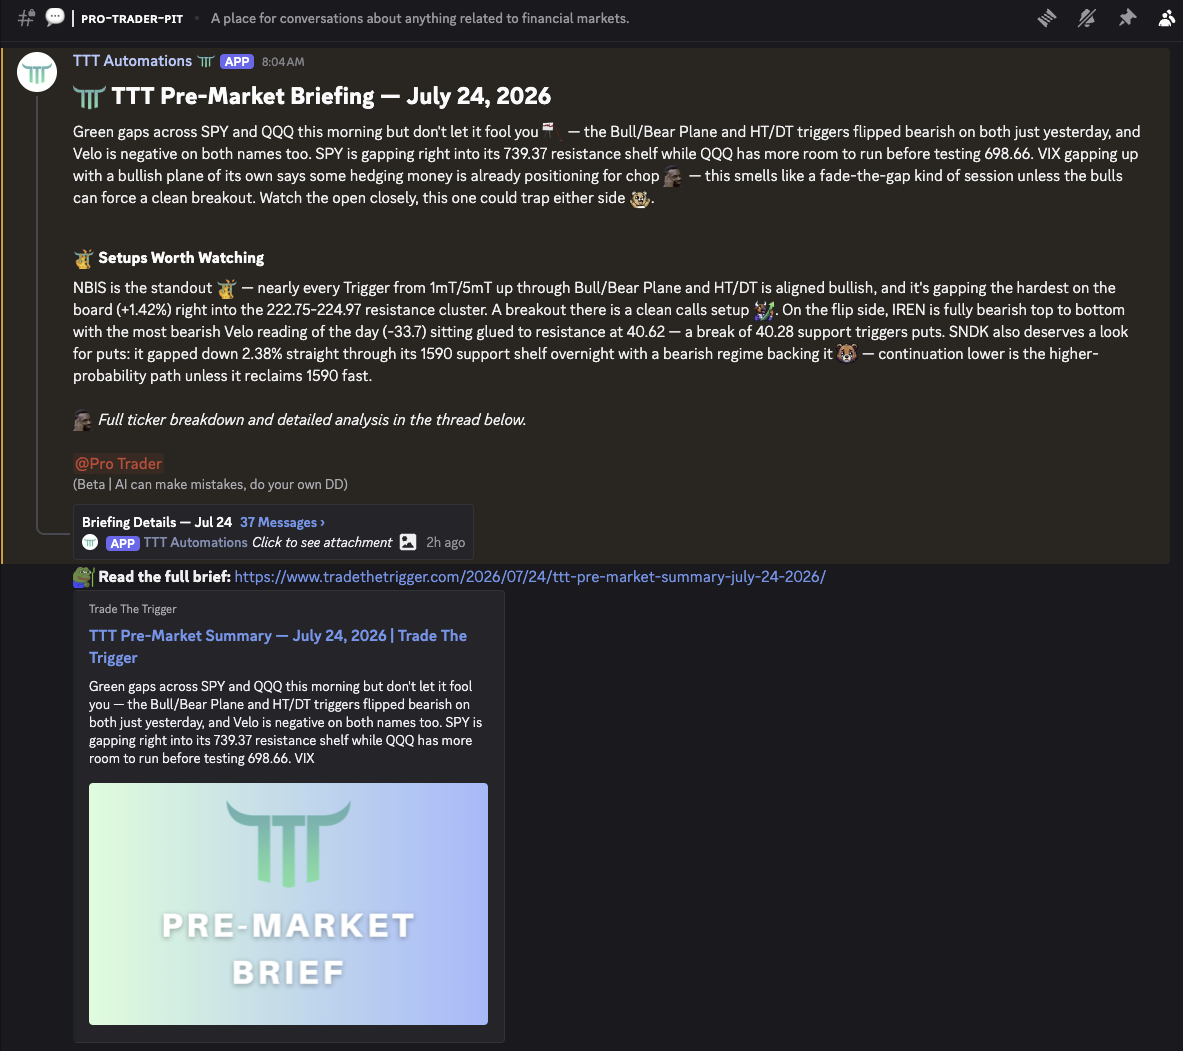
The TTT pre-market briefing posted in Discord

The read, before the bell.

The morning post calls the tone of the session. Here’s one: “green gaps, but the Plane and HT/DT flipped bearish… this smells like a fade-the-gap kind of session.” Underneath, a thread breaks down every name on the board with its levels, its regime, and the setups worth your attention.

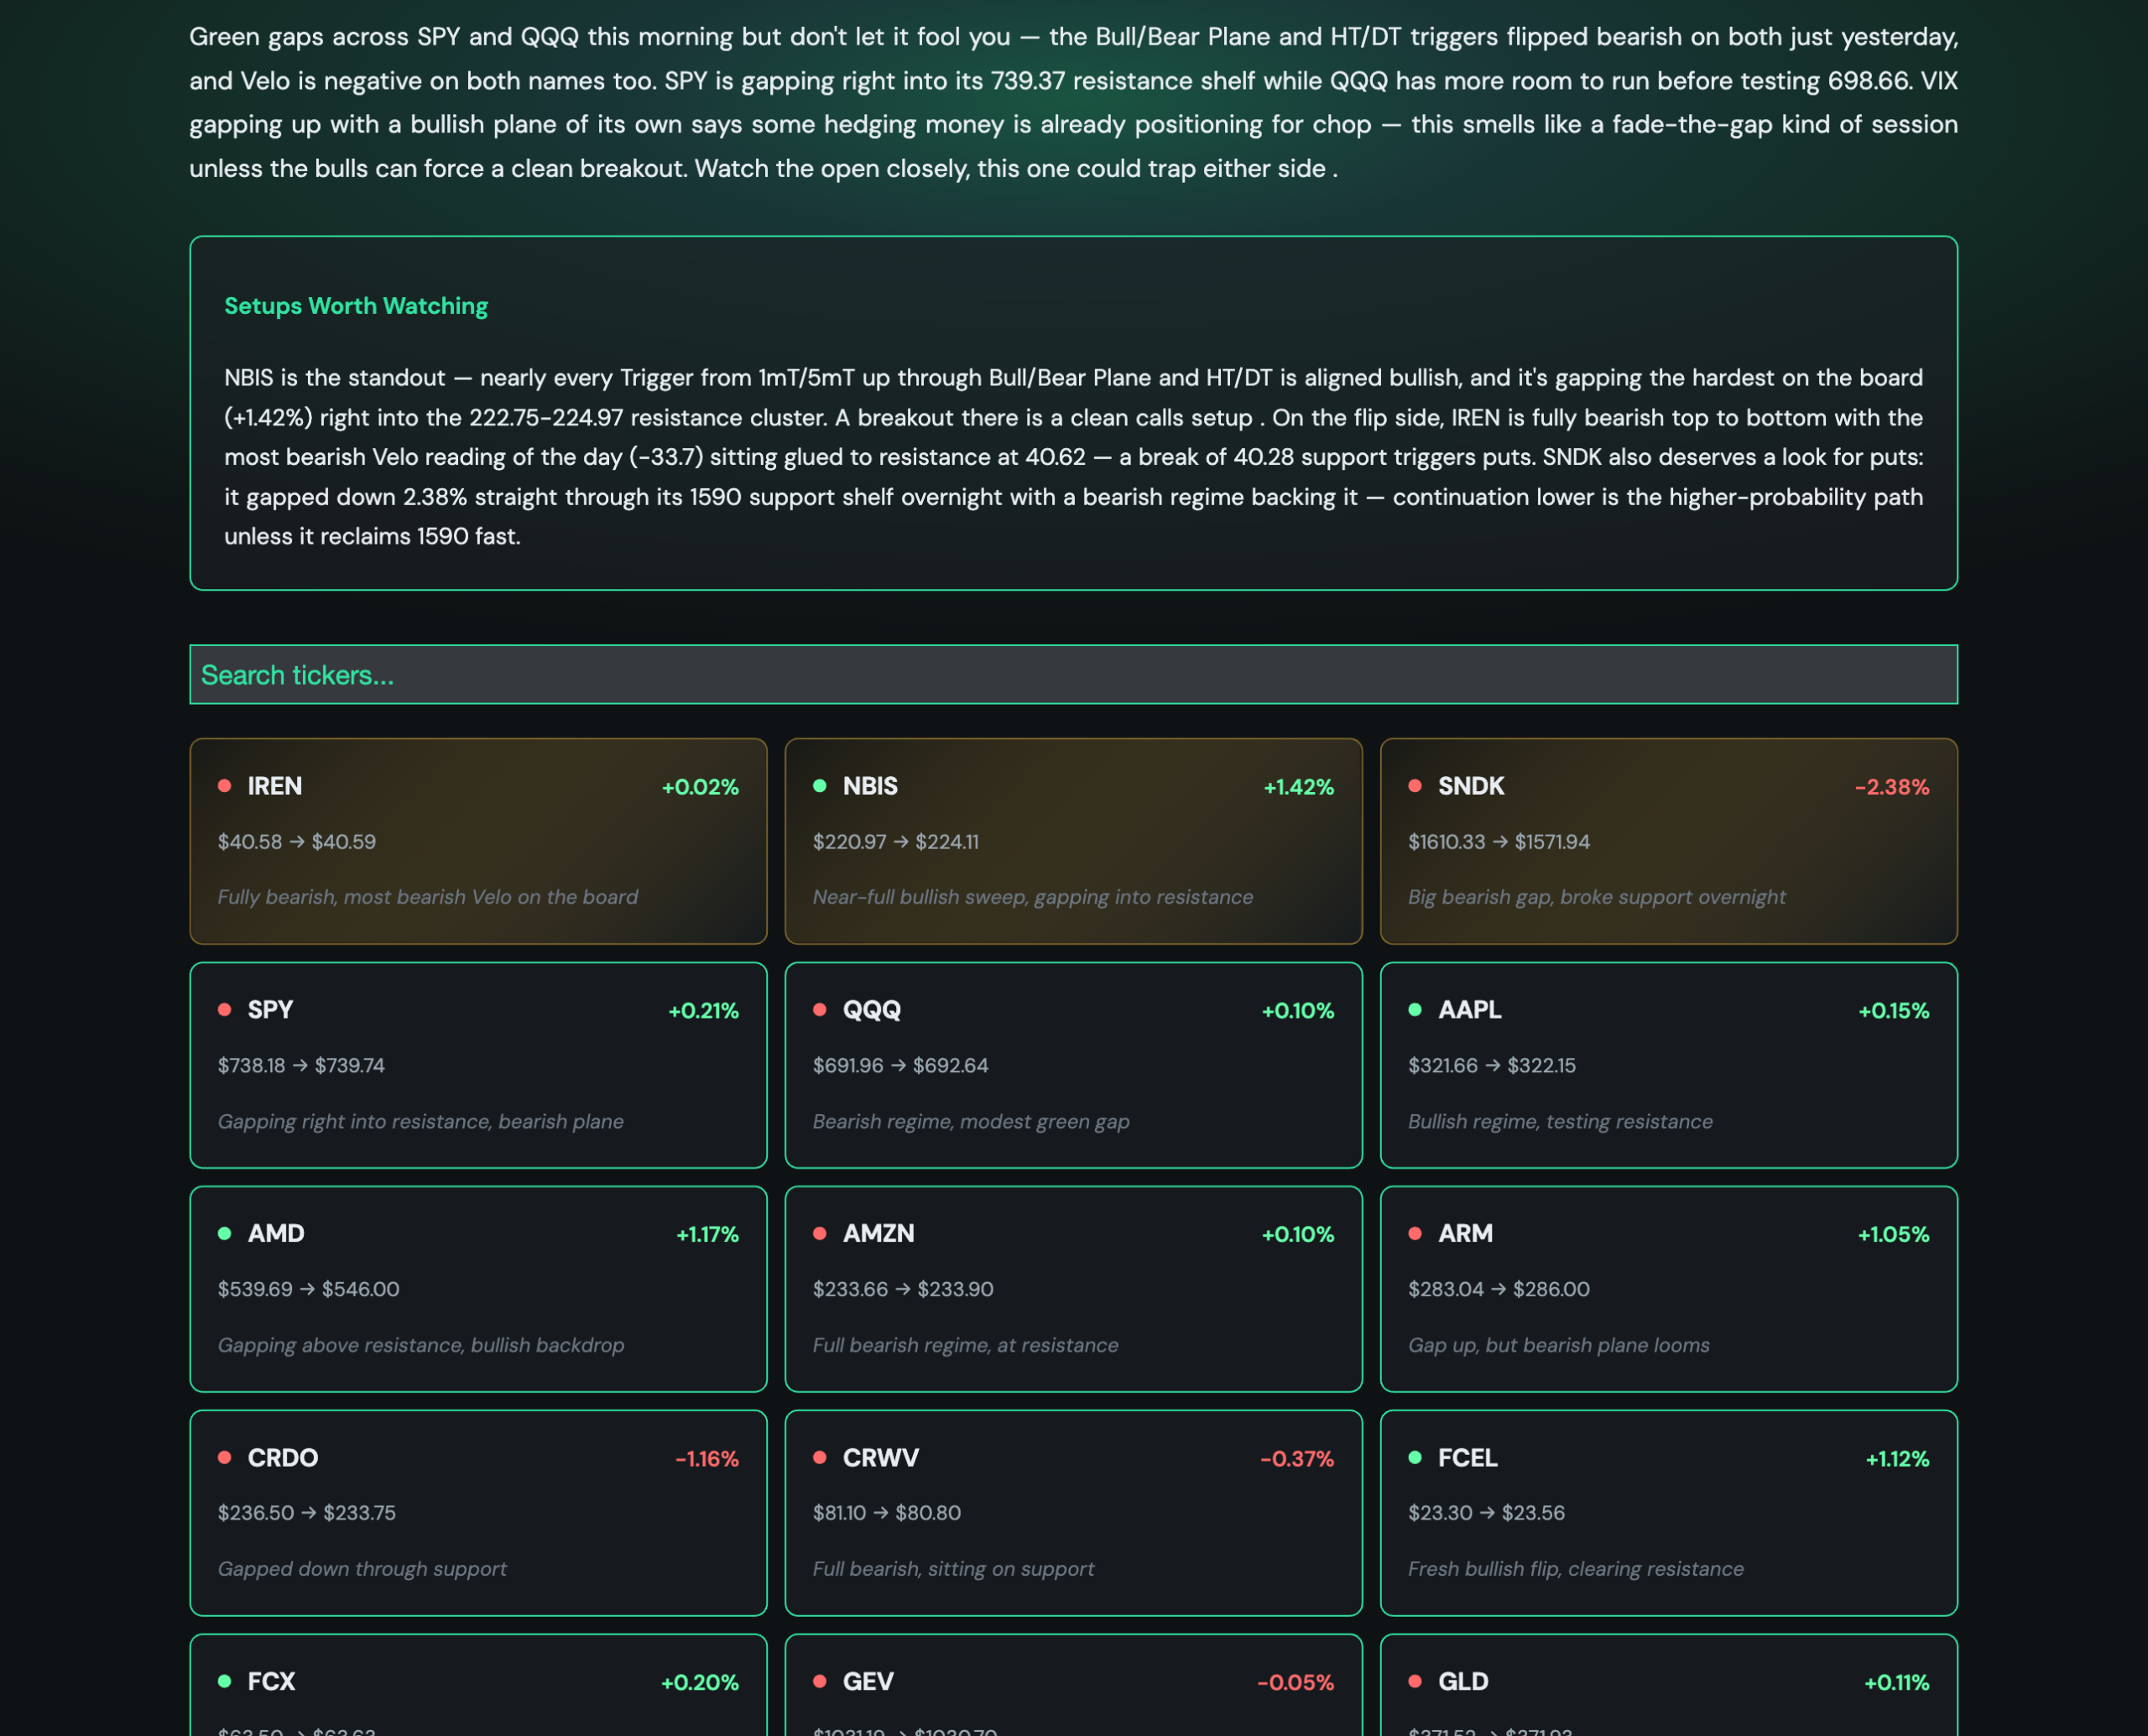
It doesn’t stay trapped in Discord either. Every brief also gets published as a clean, searchable web post. You get a card grid of every ticker with its gap, its levels, and a one-line read, plus a search box to jump straight to any symbol.

tradethetrigger.com › ttt-pre-market-summary
The web version of the pre-market brief with a searchable ticker card grid

The web brief. The whole board at a glance. Featured setups get highlighted, every ticker is searchable, all on the TTT dark theme.

The follow-up · ~10:00 AM ET Pro Trader

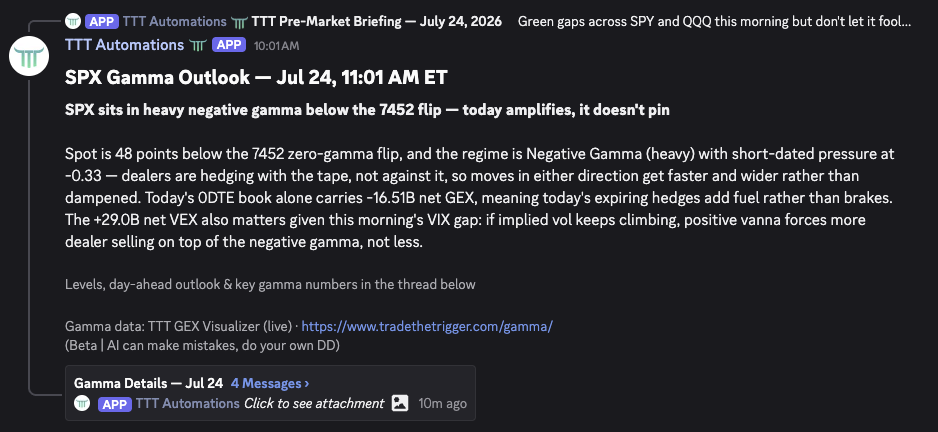
The rest-of-day read: Intraday SPX Gamma Outlook

The brief tells you where the day starts. About 30 minutes after the open, once the opening rotation settles, TTT follows up with an intraday SPX gamma read. It posts right under the morning brief, so the two read as one story.

It calls the zero-gamma flip, the call and put walls, net GEX and VEX, and the regime (positive or negative gamma). That’s the dealer-positioning map, and it tells you whether the tape wants to pin and fade, or stretch and accelerate.

The intraday SPX gamma outlook posted as a follow-up to the morning brief

The headline read, straight off the post: “SPX sits in heavy negative gamma below the 7452 flip — today amplifies, it doesn’t pin.”

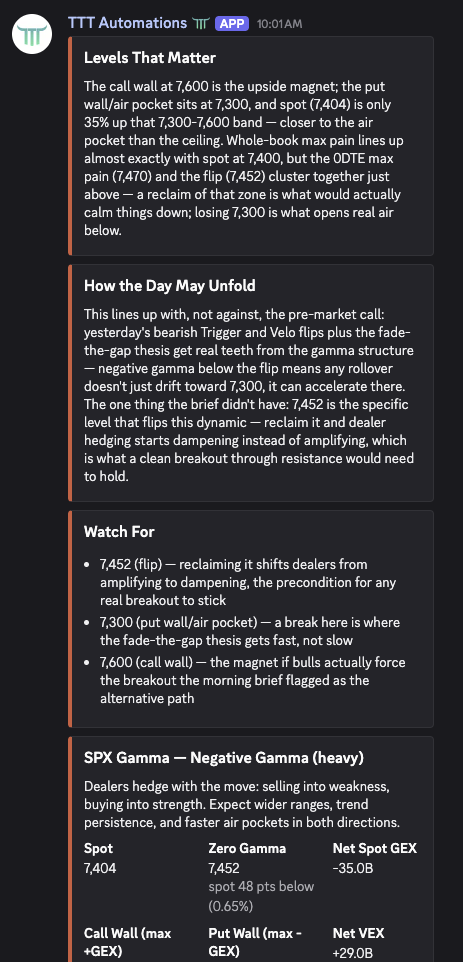
The gamma details card: levels that matter, how the day may unfold, and key gamma numbers

See the whole book.

The thread lays out the levels that matter, how the day may unfold, and the key gamma numbers in plain English. And every number comes live from the TTT GEX Visualizer, so you’re never taking the read on faith. Open the full tool and see the same book yourself: net GEX by strike, calls vs. puts, the gamma profile, and where the walls sit.

The tool itself All paid memberships

Good news if you’re on the Subscriber plan: the GEX Visualizer is open to every paying member, so you can pull the same gamma book yourself any time. The written outlook that reads it for you each morning is the Pro Trader piece.

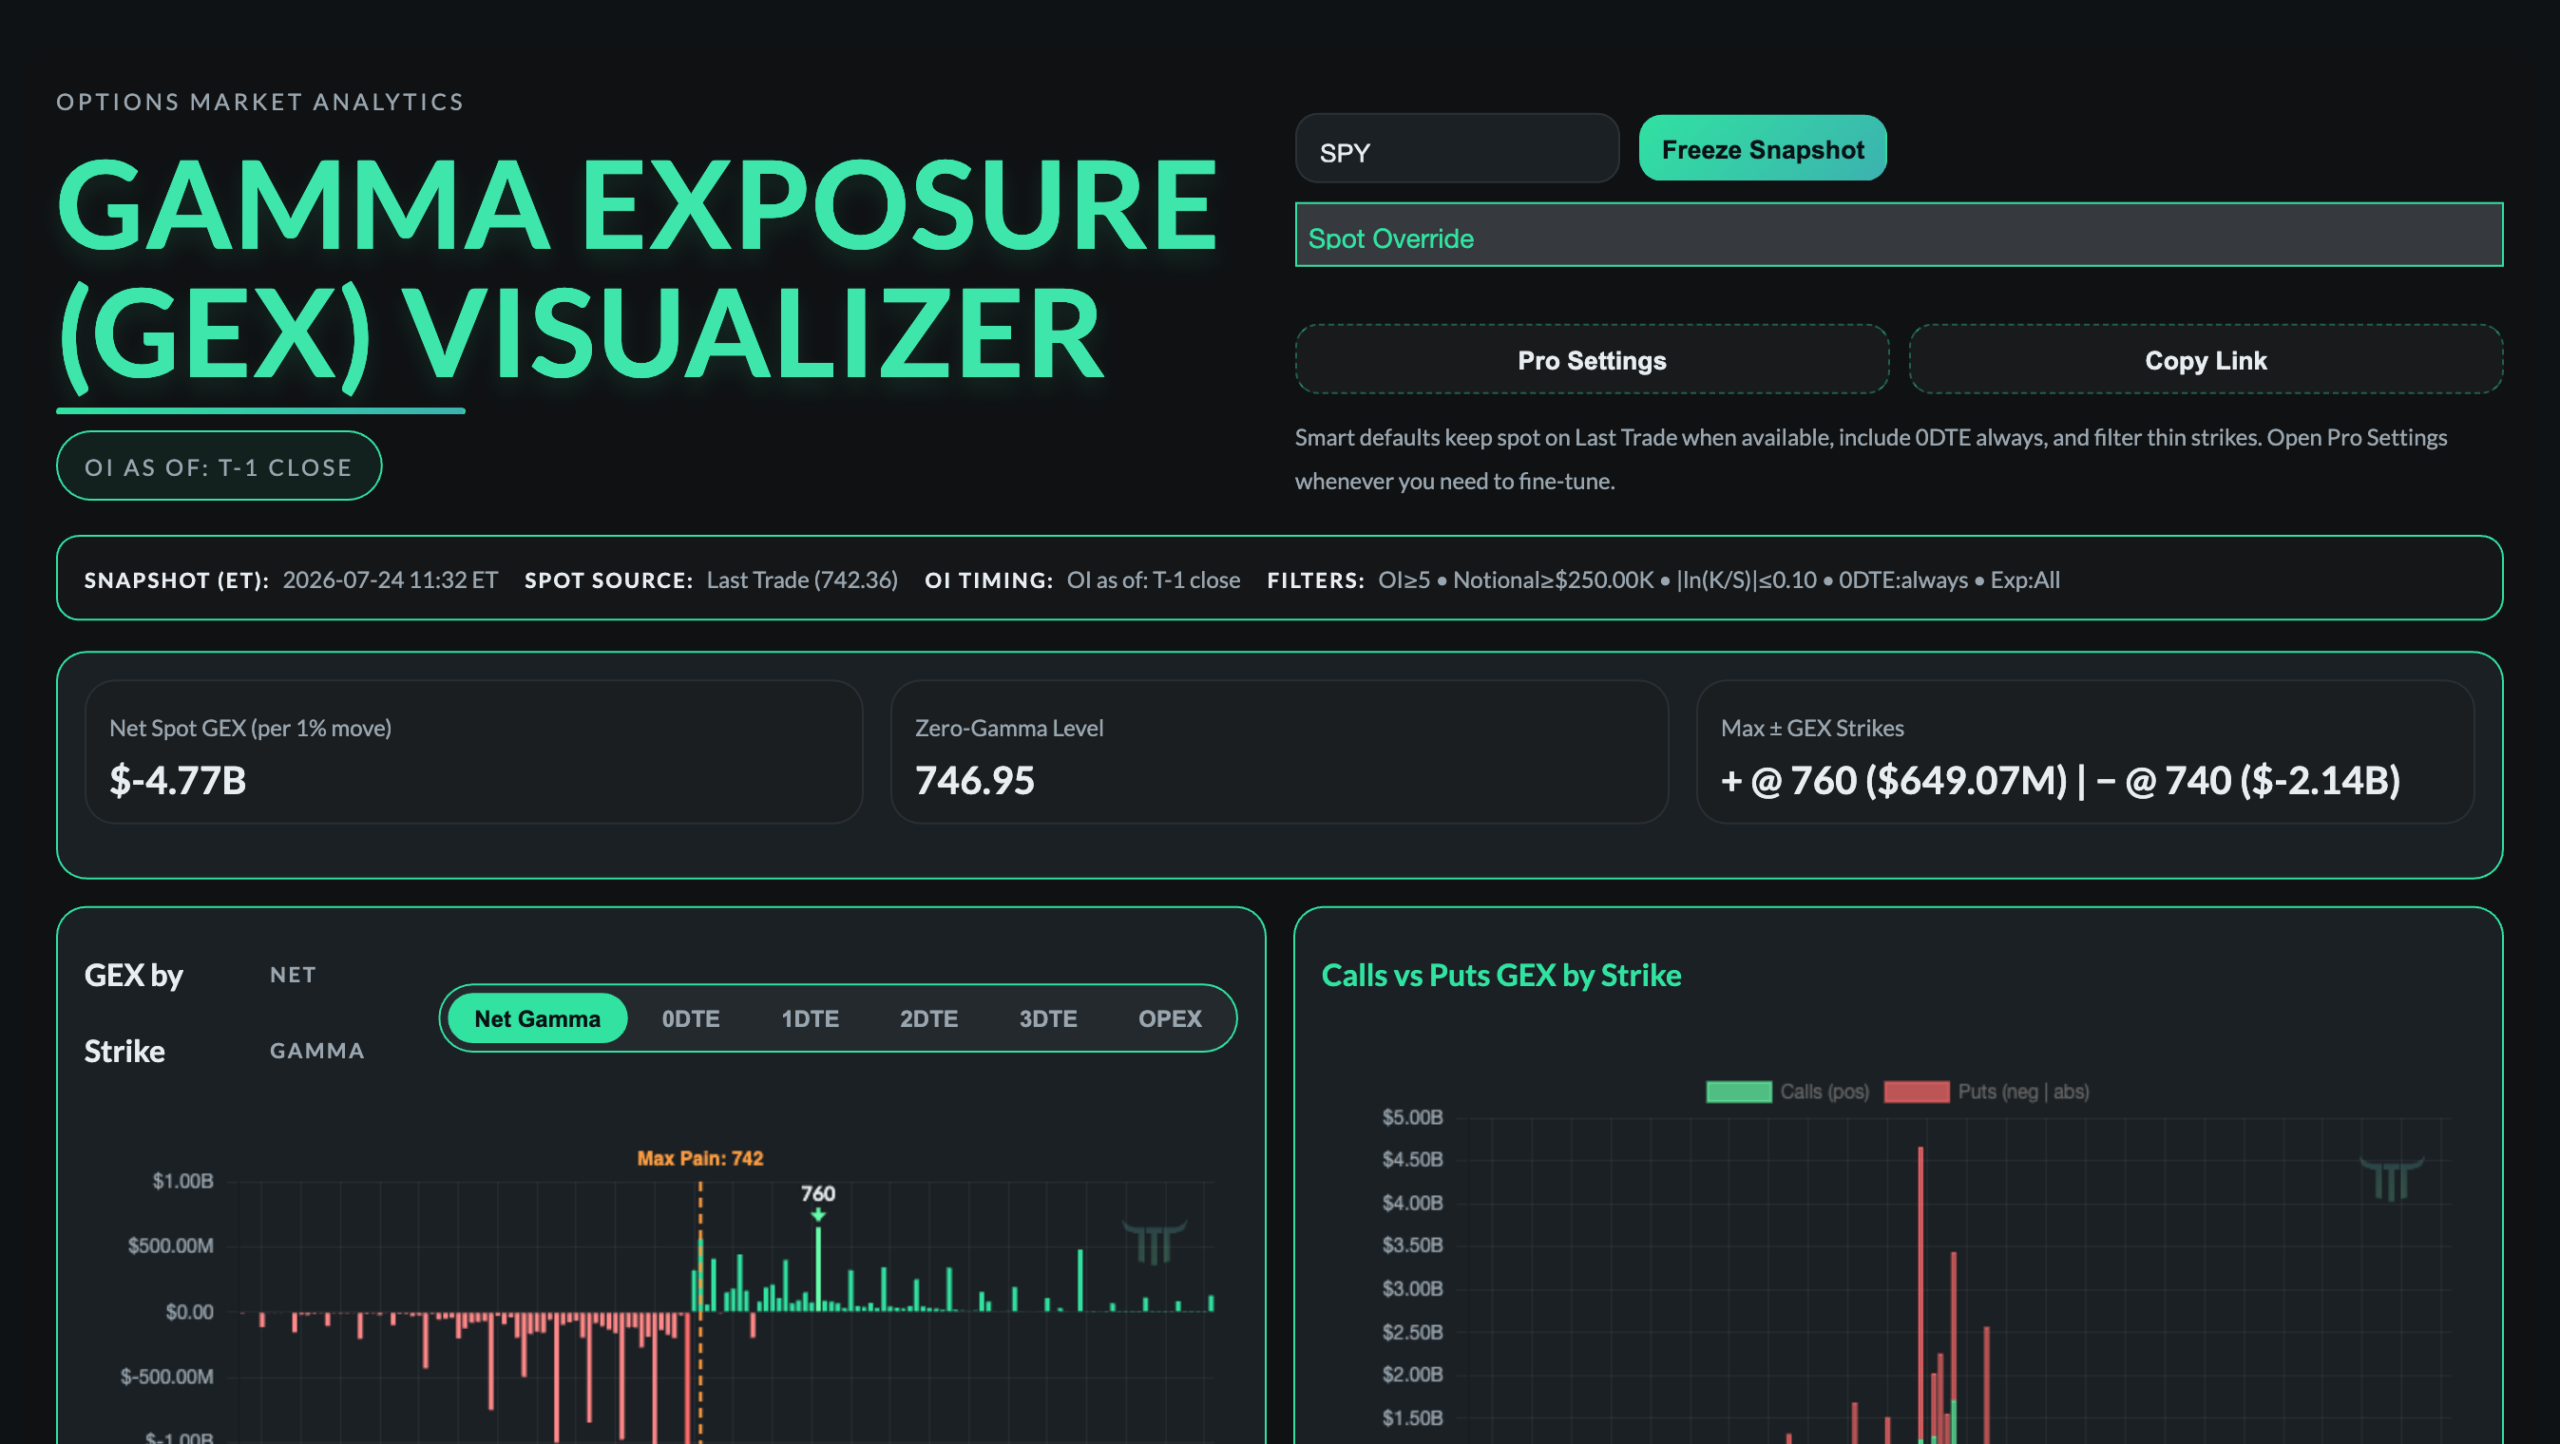
tradethetrigger.com/gamma
The live TTT GEX Visualizer showing net spot GEX, zero-gamma level, and GEX by strike

The GEX Visualizer. The same live book the outlook reads from: net spot GEX, the zero-gamma level, max ± strikes, and the full gamma-by-strike breakdown.

How it fits together

A day in the life

Here’s how the four pieces come together on a normal trading day.

8:00 AM
Pre-Market Brief
The overnight read, the setups worth watching, and the full board. In Discord and on the web.
9:30 AM
The Open
Your watchlist goes live. TTT starts watching for triggers across every timeframe.
~10:00 AM
Gamma Outlook
The dealer-positioning map for the rest of the session, right under the morning brief.
All session
Real-time DMs
Crossovers, Z-Score, and LR Channel alerts land the moment they fire, plus after-hours if you want them.

Who gets what

Where the alerts live

The Discord trading alerts are a Pro Trader feature. The crossover DMs, the Alert Manager, the daily pre-market brief, and the intraday gamma outlook all come with Pro Trader. The GEX Visualizer on the site is open to every paying member.

Subscriber
$49 / month
  • GEX Visualizer on the website
  • T3 Daily Pivots for TradingView
  • Basic Discord access
  • T3 Market Updates and education
  • Crossover alert DMs
  • The Alert Manager
  • Daily pre-market brief
  • Intraday gamma outlook
Everything in this post
Pro Trader
$150 / month
  • Everything in Subscriber
  • Real-time crossover alert DMs
  • The Alert Manager and your watchlist
  • Daily pre-market brief, Discord and web
  • Intraday SPX gamma outlook
  • Full T3 Indicator Suite for TradingView
  • Premium Discord with the T3 team

Already a Subscriber? This is the upgrade. Everything above turns on the moment you move to Pro Trader, and your watchlist starts feeding the morning brief the next trading day. Pay yearly and you get a month free.

Two minutes to set up

Get started

1
Go Pro Trader
Subscribe or upgrade. This is the tier that unlocks the alerts, the brief, and the gamma outlook.
2
Join the Discord
Hop into the TTT server with your membership and the premium channels open up.
3
Run /alerts
Add up to five tickers and build the watchlist you actually trade.
4
Pick your signals
Turn on the alerts you want, and make sure your DMs are open.
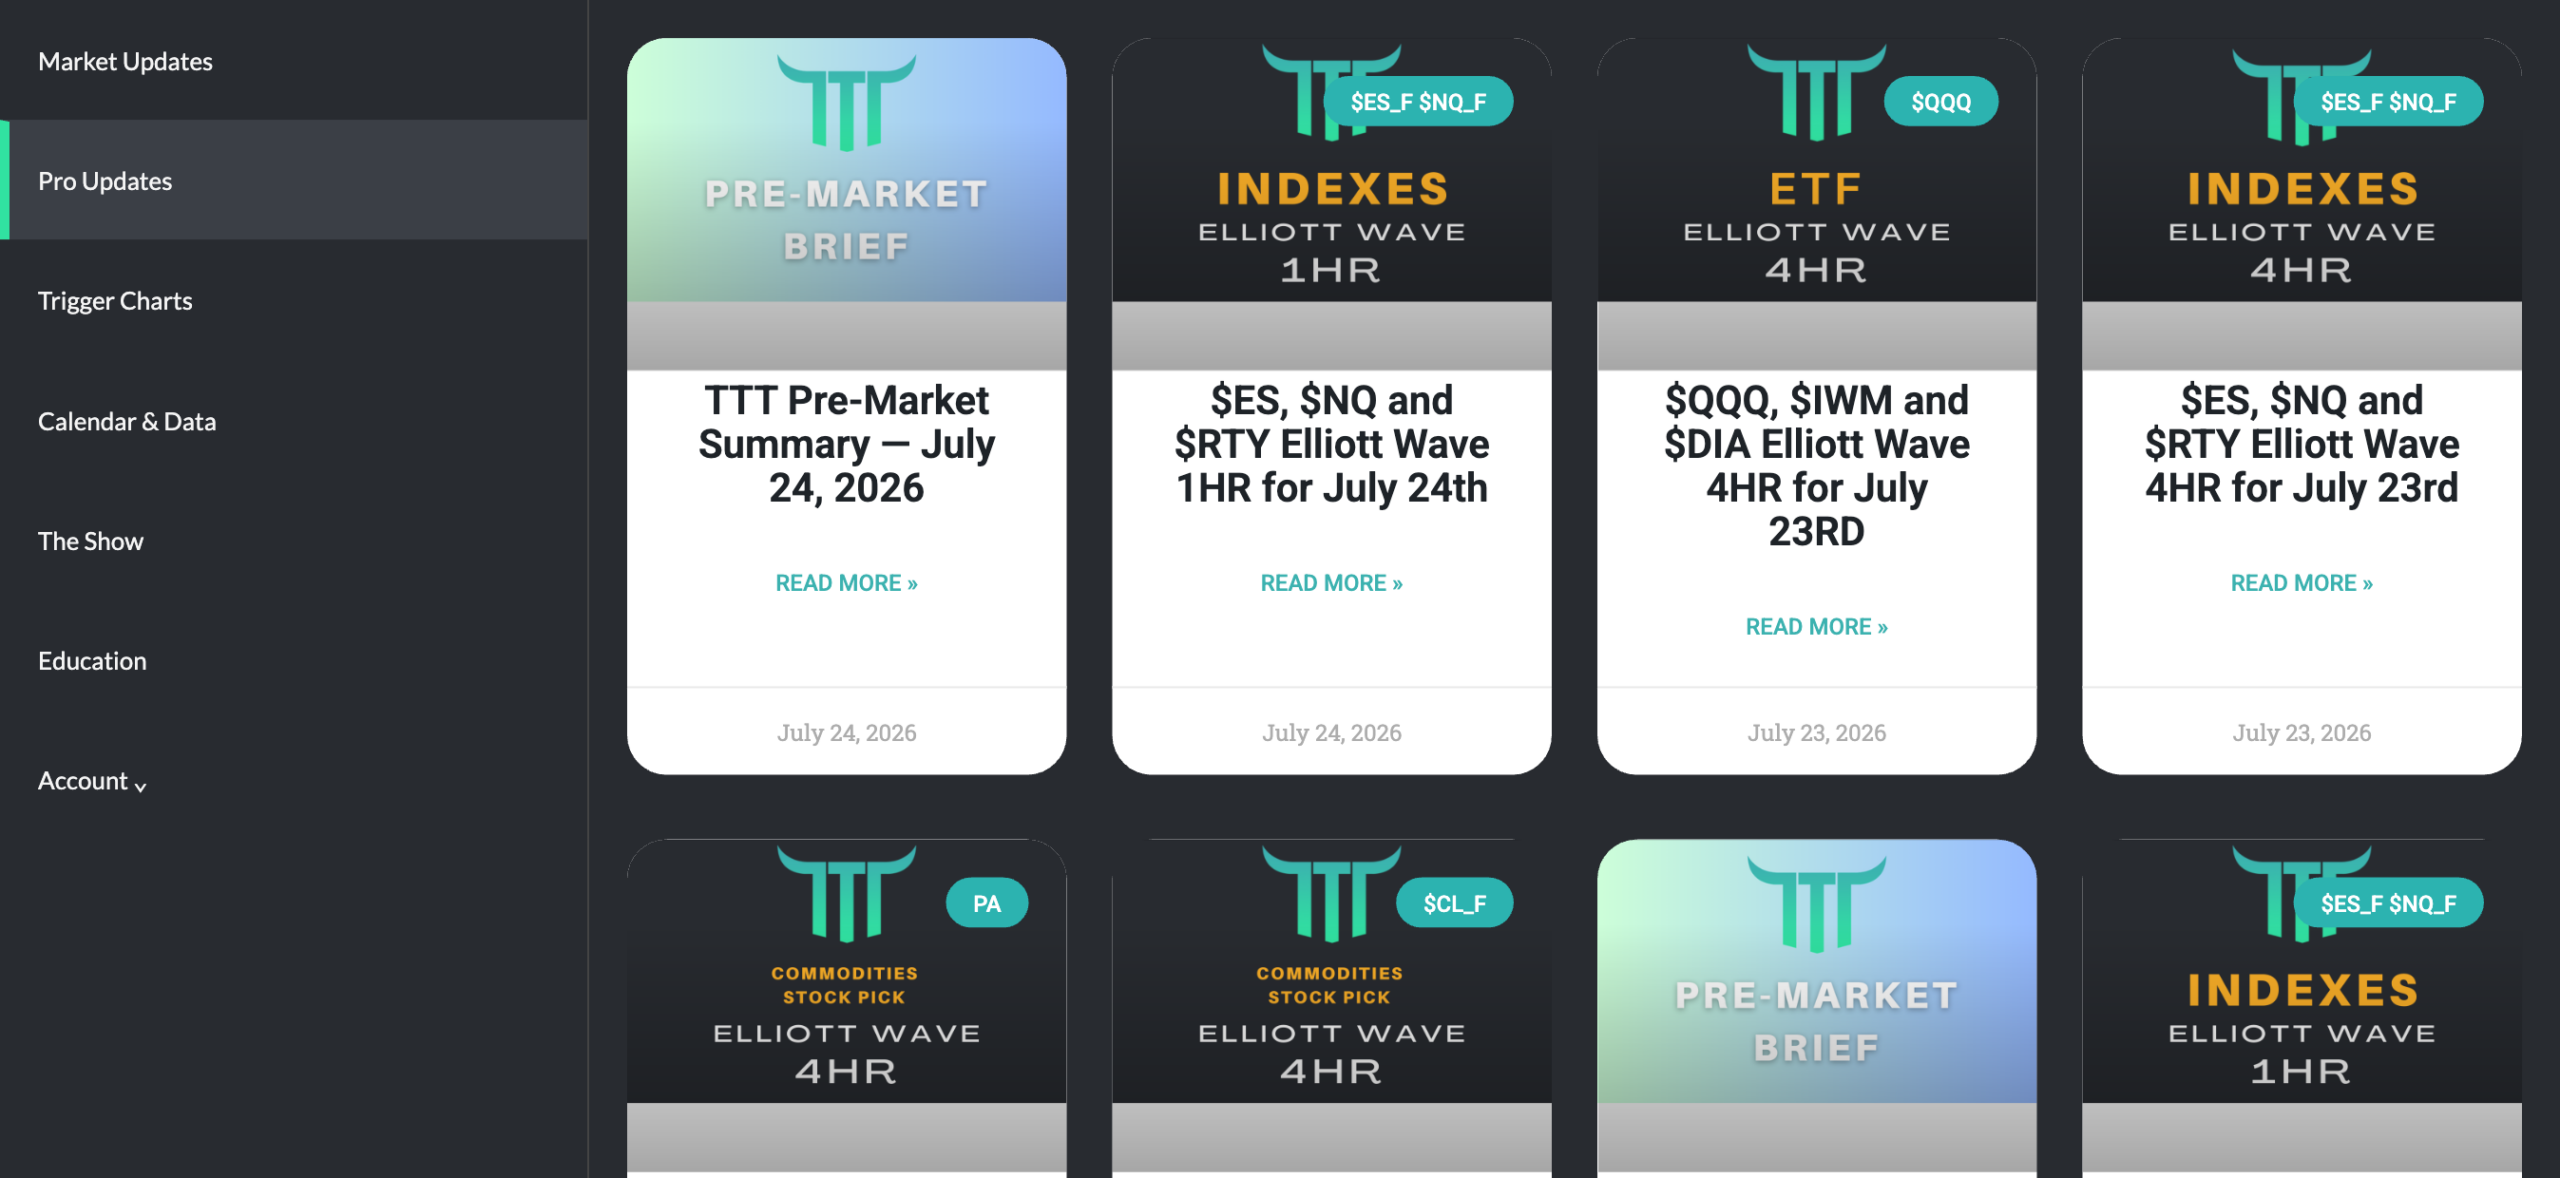
tradethetrigger.com/custom-dashboard/#pro-updates
The Pro Trader tab of the member dashboard, with pre-market briefs alongside the Elliott Wave updates

Your member hub. Every pre-market brief lands in the Pro Trader tab, right next to the Elliott Wave updates and the rest of the pro content.

Trade the day with Pro Trader

Real-time triggers, a pre-market read built around your watchlist, and an intraday gamma map, so you’re never the last to know. New here or upgrading from Subscriber, it’s the same tier.

Beta · AI can make mistakes, so always do your own DD. The pre-market brief and gamma outlook are AI-generated market commentary, not trade signals or recommendations. Nothing here is financial advice. Options and active trading carry real risk. Trade your own plan.

Hero banner for Agent-Ready: Model Context Protocol, with a Zero Gamma label and stylized bar chart in the background; conveys a AI options-market concept.

Trade The Trigger now runs a public MCP server so your AI can pull real SPX gamma exposure, pricing, and FAQ data. See what it does and how to connect.

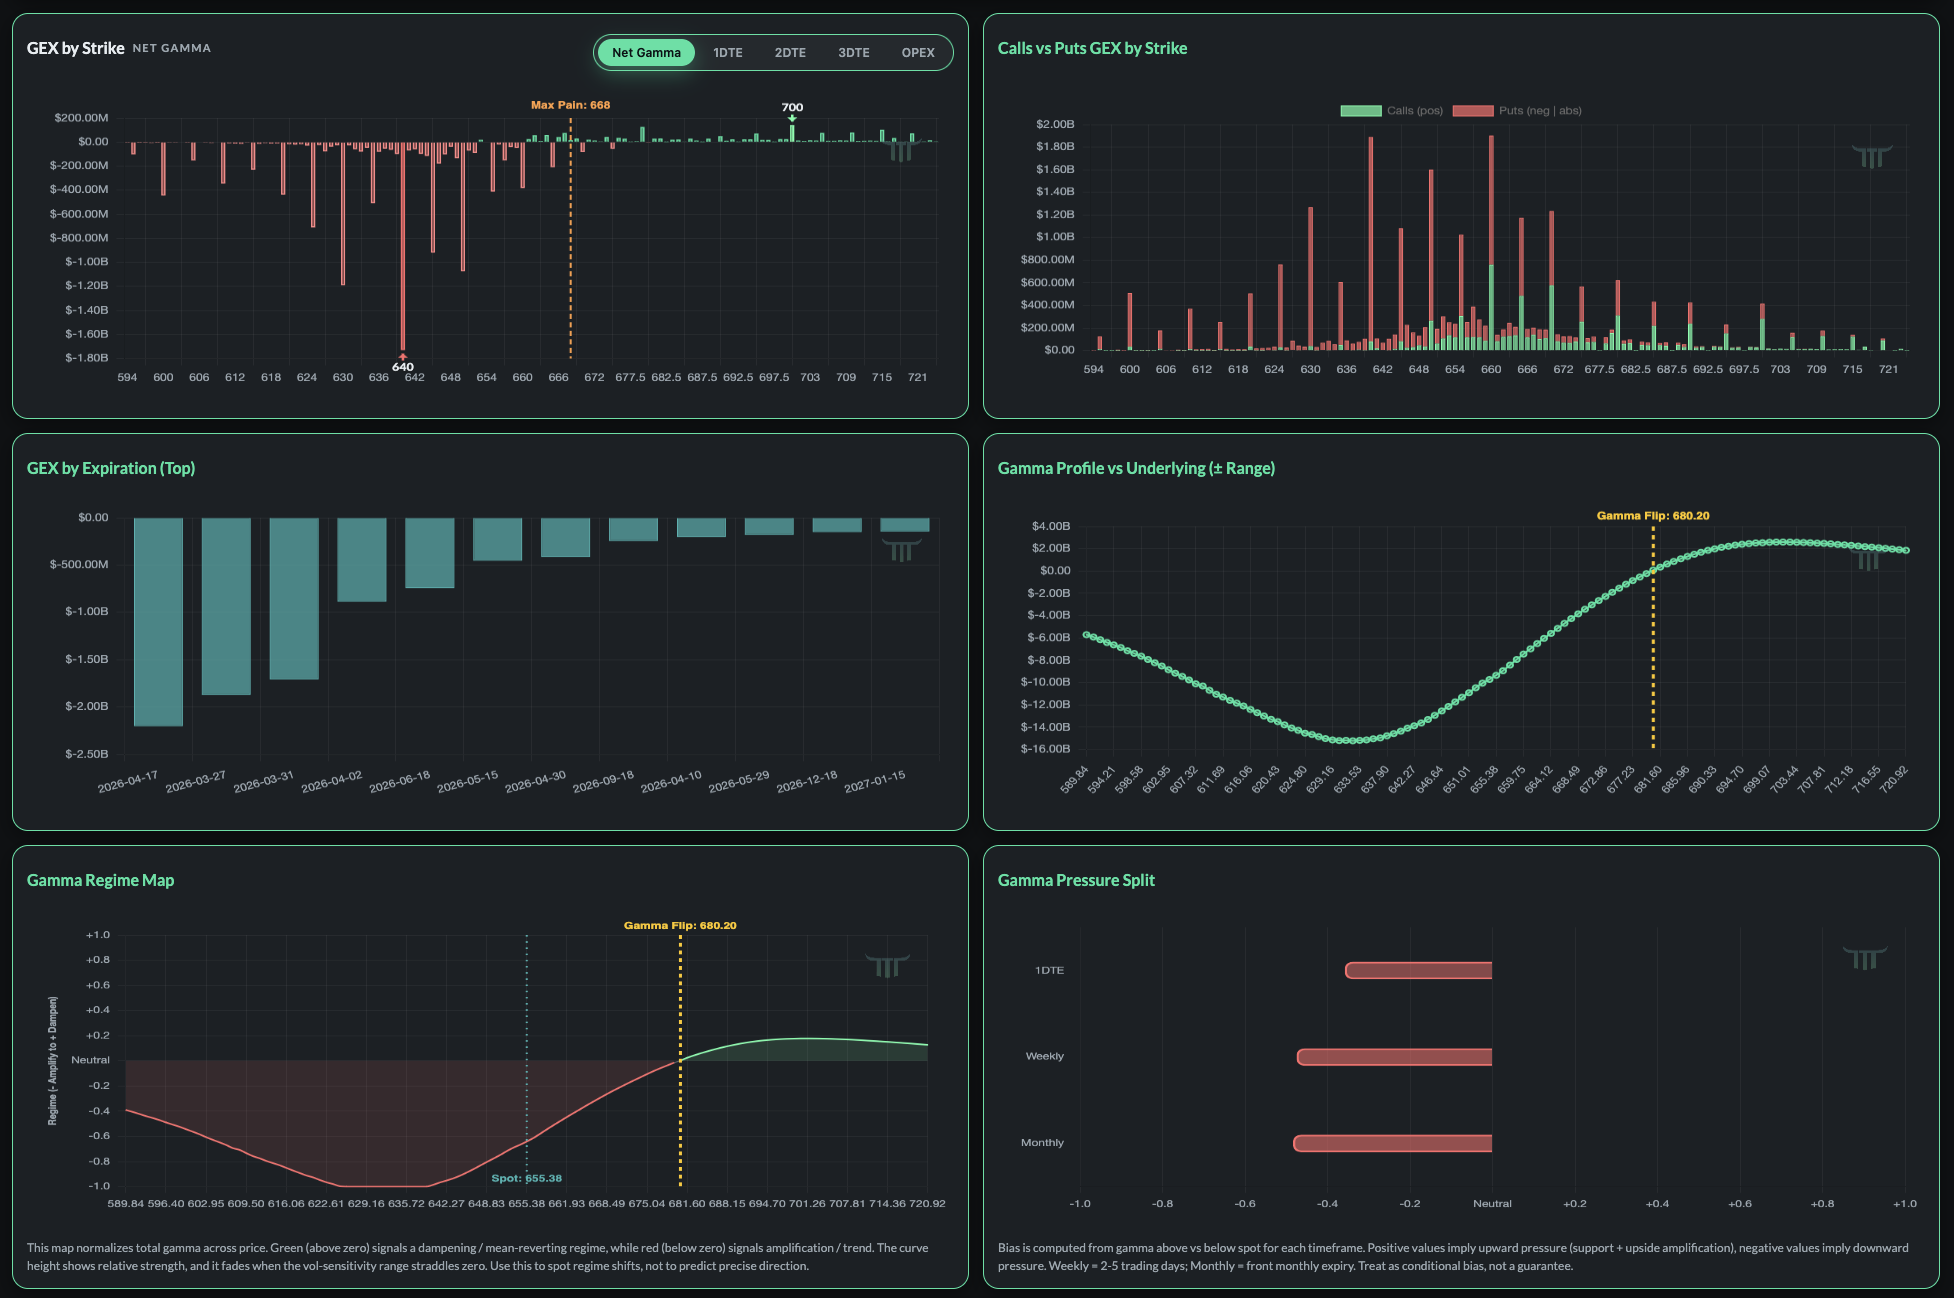
6 panels displaying various gamma visualization charts.

If you trade options, or you trade names where options positioning clearly matters, you need a way to see where the market is more likely to get pinned, where it can move cleanly, and where dealer hedging can start pressing on price instead of calming it down. That is exactly what the Gamma Exposure Visualizer is built to do.

I do not use gamma as a magic prediction tool. I use it to understand structure. Where is the market likely to stay sticky? Where can it accelerate? Which expirations are actually driving the tape? Once you understand that, your entries, exits, targets, and risk decisions get a lot cleaner.


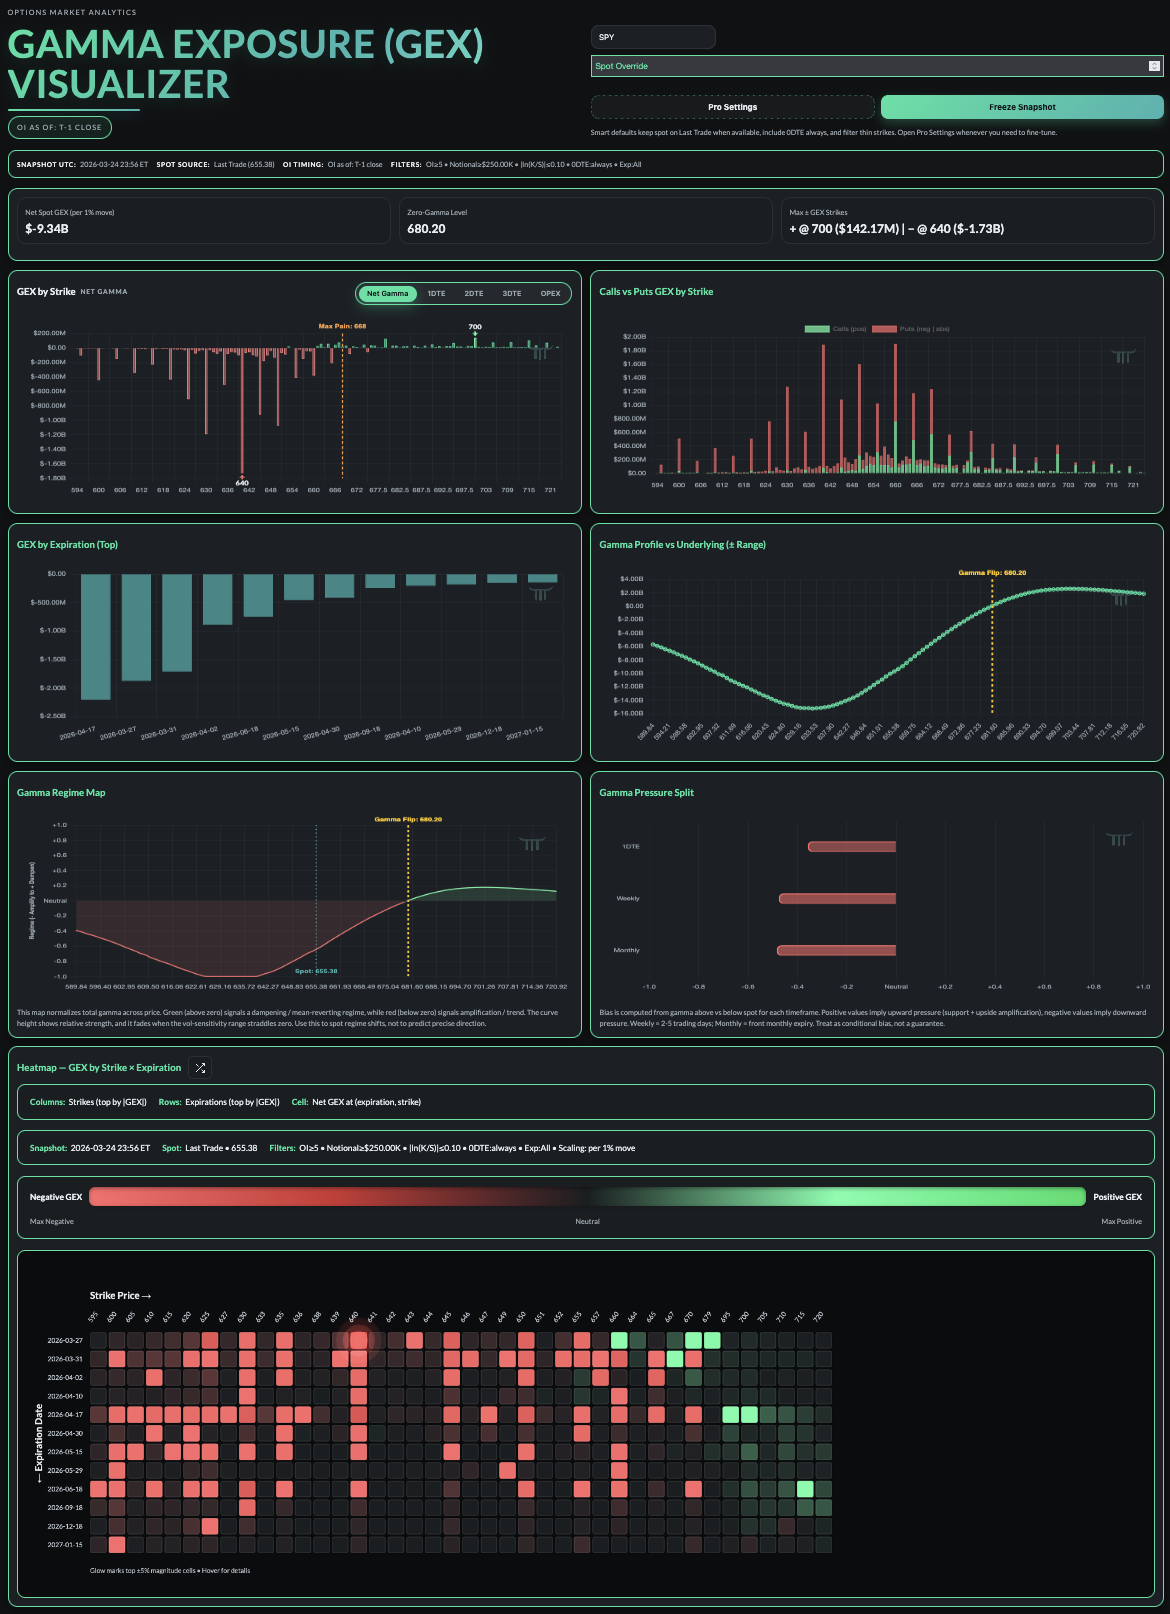
Trade The Trigger Gamma Exposure Visualizer full dashboard screenshot
The full Gamma Exposure Visualizer dashboard maps net gamma, strike structure, expiry influence, regime shifts, and pressure splits in one place.

The point of this tool is simple. It takes a pile of options data and turns it into a read on market structure you can actually use. Instead of staring at raw chains and trying to guess which levels matter, you can quickly see where positioning is likely to dampen price and where it may amplify the move.

Why Gamma Matters

Most traders hear terms like gamma flip, call wall, put wall, 0DTE, and max pain all the time, but they never turn those ideas into a practical process. Gamma becomes useful when it helps answer real questions.

  • Is the market more likely to mean revert or trend?
  • Which strikes matter most right now?
  • Which expiration is actually driving the book?
  • What changes if price moves into a new zone?

At a high level, positive gamma tends to support more dampened price action and negative gamma tends to support more reactive price action. That does not mean gamma tells you exact direction. It means gamma helps explain the environment price is moving through.

Key Terms You Should Understand First

Gamma: The rate of change of delta as the underlying moves.

Gamma Exposure (GEX): A market-wide estimate of how much gamma is sitting in the options book.

Positive GEX: Usually associated with dealer hedging that dampens movement and supports mean reversion.

Negative GEX: Usually associated with dealer hedging that can amplify movement and support trend or acceleration.

Zero Gamma / Gamma Flip: The price level where net gamma changes sign.

Strike: The option strike price where positioning can cluster.

DTE: Days to expiration.

0DTE: Options expiring the same day.

OPEX: Options expiration, usually the monthly cycle traders pay close attention to.

Open Interest: The number of open contracts at a given strike and expiration.

Max Pain: The strike where aggregate option pain is minimized into expiration. Useful as context, not something to worship.

Call Wall / Put Wall: Trader shorthand for heavily positioned strikes that can behave like support, resistance, pinning zones, or magnets.

Start At The Top Of The Tool

Before you get lost in the charts, read the controls and the snapshot data. That tells you exactly what book you are analyzing.

Core Controls

  • Ticker lets you choose the underlying.
  • Spot Override lets you model a hypothetical price and see how the structure changes.
  • Pro Settings let you fine-tune things like OI thresholds, notional filters, strike distance, and expirations.
  • Freeze Snapshot locks the current read so you can analyze a stable view instead of chasing a moving target.

Snapshot Bar

  • Snapshot time tells you when the view was captured.
  • Spot source tells you where the current price is coming from.
  • OI timing matters because open interest is often delayed, not truly live.
  • Filters tell you exactly what data is included in the read.

That context matters. If the tool is showing net spot GEX per 1 percent move, treat that as a sensitivity estimate. It is not a static pile of money. It is a way to understand how much hedging pressure may show up as price moves.

Quick rule: Read gamma as context, not prophecy. It gives you a map of where dealer flow may dampen or amplify price. It does not replace price action, news, or risk management.

The Three Numbers To Read First

The fastest way to get useful information from the dashboard is to read the headline stats before you touch anything else.

  1. Net Spot GEX tells you the current posture of the book.
  2. Zero-Gamma Level tells you where that posture flips.
  3. Max Positive and Max Negative GEX Strikes show where the largest concentrations are sitting.

That immediately gives you a framework. Is this a more dampened environment or a more reactive one? Where does the regime change? Which strikes deserve attention first?

How To Read Each Part Of The Dashboard

1. GEX By Strike

This is one of the main views in the entire tool. It shows where gamma is concentrated across strikes, and you can break that out by net gamma, 1DTE, 2DTE, 3DTE, or OPEX.

  • Tall green bars usually mark dampening zones where dealer flow may lean against price.
  • Deep red bars usually mark acceleration zones where dealer flow may reinforce the move.
  • The max pain line adds another reference point for the active timeframe.

This is the chart I use to answer a simple question: where are the important strike-based pockets of resistance, support, pinning, or empty air?

2. Calls vs Puts GEX By Strike

A net number can hide the real story. This panel shows whether calls or puts are doing the heavy lifting at each strike.

  • If calls are dominating one level, that can help explain why price keeps getting leaned on there.
  • If puts are stacked hard at a nearby strike, that may help explain why downside movement gets more aggressive through that zone.
  • This is one of the better views for spotting what traders loosely call walls.

3. GEX By Expiration

Not all gamma matters equally. This panel shows which expirations are actually driving the current book.

  • If one near-term expiry dominates, that can heavily influence short-term price behavior.
  • If the monthly expiry is carrying most of the weight, that matters into OPEX and around bigger positioning shifts.
  • This keeps you from treating the whole chain like one undifferentiated blob.

4. Gamma Profile vs Underlying

This shows how total gamma changes as spot moves through a range of prices. The vol-sensitivity band gives you a feel for how stable that read is if implied volatility shifts.

  • Watch where the profile crosses zero.
  • Pay attention to how sharp or gradual that flip is.
  • If the sensitivity band stays firmly on one side of zero, the read is more stable.
  • If the band straddles zero, conviction should come down.

5. Gamma Regime Map

This is one of the cleanest panels in the dashboard because it converts the gamma profile into a simpler regime read.

  • Green suggests a more dampened, mean-reverting regime.
  • Red suggests a more amplified, trend-supportive regime.
  • When the curve fades near zero, it is telling you the read is less stable there.

This panel is about market character. It is not trying to give you exact targets.

6. Gamma Pressure Split

This panel breaks directional pressure out by timeframe, typically 1DTE, weekly, and monthly.

  • Positive values can imply more support or upward pressure.
  • Negative values can imply more downside pressure or heavier downside sensitivity.
  • The timeframe split helps you see whether short-term flow and broader structure are aligned or fighting each other.

I treat this as conditional bias, not prediction.

7. Heatmap

The heatmap combines strike and expiration in one view, which is what makes it so useful. Red cells highlight concentrated negative gamma. Green cells highlight concentrated positive gamma. If the biggest cells are clustered in a tight area, that is usually worth paying attention to.

  • Use it to find where exposure is concentrated by both strike and expiry.
  • Use it to see whether an important level is isolated or supported by a larger cluster.
  • Use the flip view to think strike-first or expiry-first depending on what you are trying to answer.

A Practical Workflow

If you want to use the tool without turning it into a science project, keep the process simple.

  1. Read Net Spot GEX and Zero Gamma first.
  2. Mark the largest positive and negative strikes.
  3. Use GEX by Strike to map nearby structure.
  4. Use Calls vs Puts to see what is creating that structure.
  5. Check GEX by Expiration to find the dominant expiry.
  6. Confirm the broader environment with the Gamma Profile and Regime Map.
  7. Use the Heatmap to see whether those levels are clustered across expirations.
  8. If you are planning ahead, use Spot Override and Freeze Snapshot to model scenarios before the open or after a big move.

Potential Ways To Use It In Trading

These are not standalone signals. They are ways to turn the dashboard into a process.

Mean Reversion In Positive Gamma

If spot is above the gamma flip and the nearby structure is dominated by positive gamma, I am generally more open to fade setups and reversion trades, especially when price action confirms that read.

Trend Continuation In Negative Gamma

If spot is below the gamma flip and the heatmap shows concentrated negative gamma around or below price, breaks can carry harder than people expect. That is where I stop assuming every move will snap back.

Trading Around The Expiry That Actually Matters

If one expiration is clearly dominating the book, that is the one I care about most. That can matter for day trades, swing timing, and understanding why certain sessions feel heavier or more pinned than others.

Using Zero Gamma As A Risk Line

The gamma flip is one of the cleanest context markers in the tool. Sometimes it is less about taking a trade right at that level and more about knowing that a move through it can change the whole environment.

Scenario Planning With Spot Override

This is one of the most practical features in the dashboard. If you want to know how a gap up, gap down, or post-news move changes the structure, you can model it before price gets there and show up with a plan instead of reacting late.

What The Tool Will Not Do

The Gamma Exposure Visualizer is not a prediction machine. It does not know headlines. It does not replace tape reading. It does not eliminate risk. Open interest is not perfectly real-time, and no gamma model should be treated like a crystal ball.

What it does do is give you a much better framework for understanding why price may get sticky in one zone and move fast in another. That alone can clean up a lot of bad decisions.

Why It Matters Inside Trade The Trigger

The real value is not just having the gamma charts. The value is being able to use this tool alongside the rest of the Trade The Trigger stack and in the same environment where the setups, levels, and market reads are being discussed in real time.

Inside membership, you are not just getting access to the Gamma Exposure Visualizer. You are getting access to the broader toolset and the Discord community where traders are actively working through the same market structure, the same levels, and the same decision points together.